
I present two green competitiveness indices (GCIs) for environmental goods (ENV) and for low-carbon technology goods (LCT) constructed using 6-digit (balanced) trade data (HS 2017) from 2017-23. I provide results for the top-5 economies in 2023, for ASEAN and other selected Asian economies.
ASEAN economies are not at the top of either list. Malaysia, Singapore and Thailand are the highest ranked in both rankings. The smaller ASEAN economies such as Lao, Cambodia and Myanmar appear at the bottom end of the EVN ranking. They don’t appear in the LCT ranking at all since the list of LCT goods is smaller and more technology intensive than that of EVN goods.
Between 2017 and 2023, China and India have improved their positions in both rankings, while Japan and South Korea have declined. Singapore has improved its position while Thailand has declined marginally. Malaysia has managed to roughly hold on, declining by one place in the ENV ranking but improving by one place in the LCT rankings. Vietnam shows a marginal improvement, but Indonesia has fallen behind. The Philippines shows an improvement in the ENV ranking but has fallen behind in the LCT ranking.
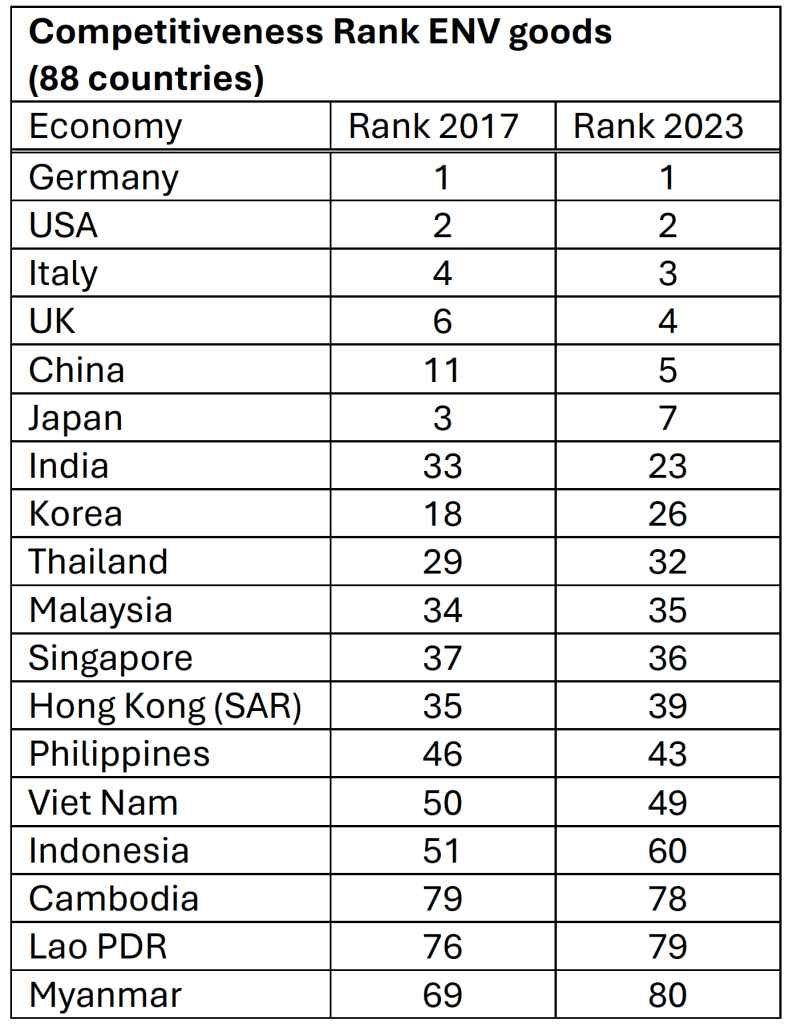
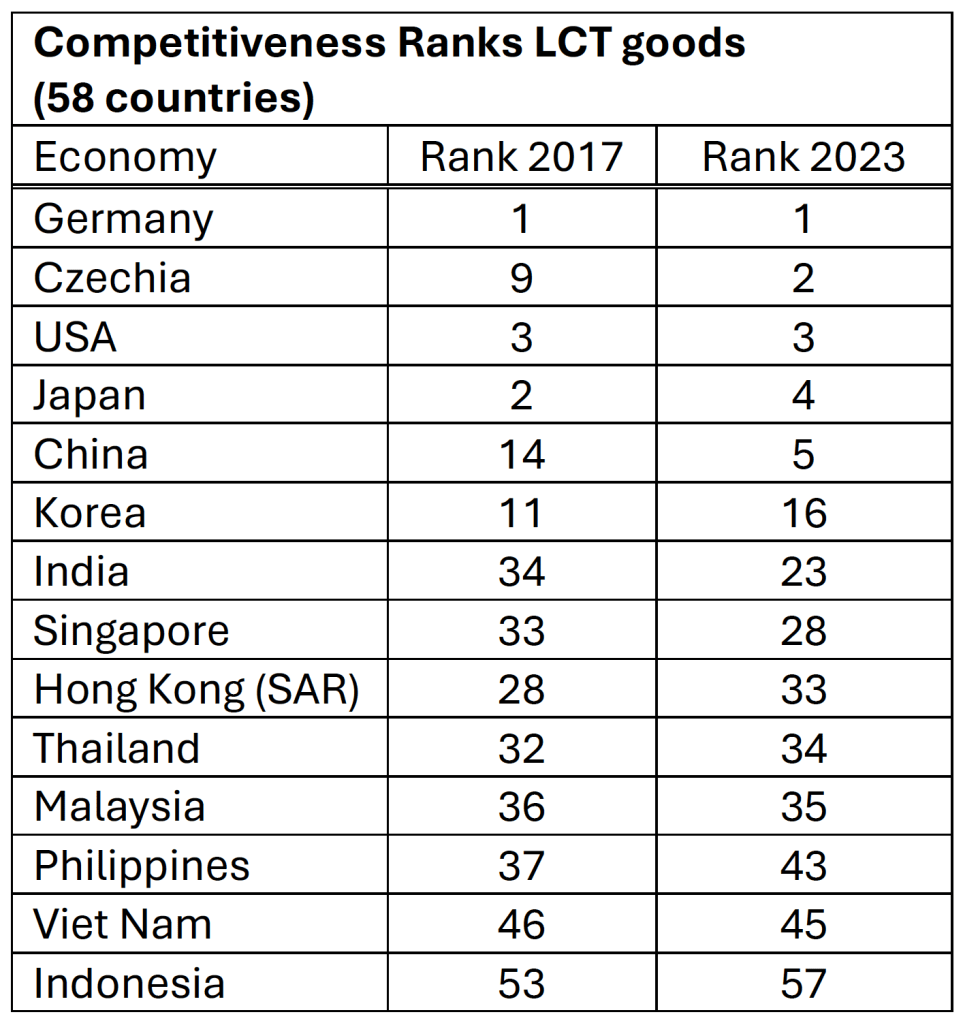
So, the ASEAN economies to watch are Malaysia, Singapore and Thailand and in a few years, Vietnam. They are all likely to benefit from their close trade and investment relationship with China, which is a leader in many areas of green technology.
What is the GCI and why does it matter?
I follow the method described in Mealy and Teytelboym, who develop a GCI using their own definition of green goods. I use the IMF definition of ENV and LCT goods. The GCI is an RCI weighted index of product complexity scores. The RCI (index of revealed competitive advantage) is a measure of over-representation of a product in a country’s export basket (relative to the world). It tells us what countries are good at exporting.
Constructing the index is a two-step process. Step one involves making a product complexity index (PCI) (Hidalgo and Hausmann) for (almost) all 6-digit traded products. Step two uses RCI weights in aggregating the product complexity scores of ENV and LCT goods.
The product complexity index tells us something about the capabilities of countries. This and the associated economic complexity index are correlated with a country’s income level and are also predictors of future economic growth.
As Hidalgo and Hausmann (2009) state:
“… countries tend to converge to the level of income dictated by the complexity of their productive structures, indicating that development efforts should focus on generating the conditions that would allow complexity to emerge in order to generate sustained growth and prosperity.”
This approach is based on the premise that by observing the (complexity of) products a country is good at exporting, it is possible to infer the capabilities of a country. Capabilities are local and specific to certain products, although they may be transferrable to other products. Capabilities are defined very broadly and can include anything and everything. Hidalgo (2009) states:
“Capabilities could be tangible inputs, such as bridges, ports and highways, or intangibles, such as norms, institutions, skills or the existence of particular social networks.”
Two other concepts deserve mention – diversity and exclusivity. Hidalgo and Hausmann (2009) compare Malaysia and Pakistan, and observe that:
“… while Malaysia and Pakistan export the same number of products, the products exported by Malaysia are exported by fewer countries than those exported by Pakistan. … we see that Malaysian products are exported by more diversified countries than the exports of Pakistan. This suggests that the productive structure of Malaysia is more complex than that of Pakistan.” (emphasis added)
Complex products are exclusive (sophisticated) and exported by fewer countries – compare aircraft engines with men’s shirts. Few countries are good at exporting the former and many countries are good at exporting the latter. Manufactured goods and chemicals etc. are more complex than garments and agricultural products. And countries which have a variety of capabilities or a wider combination of capabilities can make a variety of (more complex) products.
How do you get ahead?
Hidalgo and Hausmann (2009) suggest that theirs is a capability-based theory of economic development. Better and more varied capabilities lead to more complex products and therefore to higher economic growth. They prescribe that:
“… development efforts should focus on generating the conditions that would allow complexity to emerge in order to generate sustained growth and prosperity.”
They have very little to say about how capabilities emerge; how they are accumulated and how (lower-ranked) countries can develop new capabilities. In fact, Hidalgo (2009) states that they are innate. He develops economic complexity rankings for a group of countries for a 42-year period (1963-2005) and identifies countries which moved up the rankings substantially. The “great transformers” included Singapore, China, Korea, Thailand, Malaysia, Indonesia and a few others (see below – reproduced from Hidalgo (2009), Figures 2b and c).
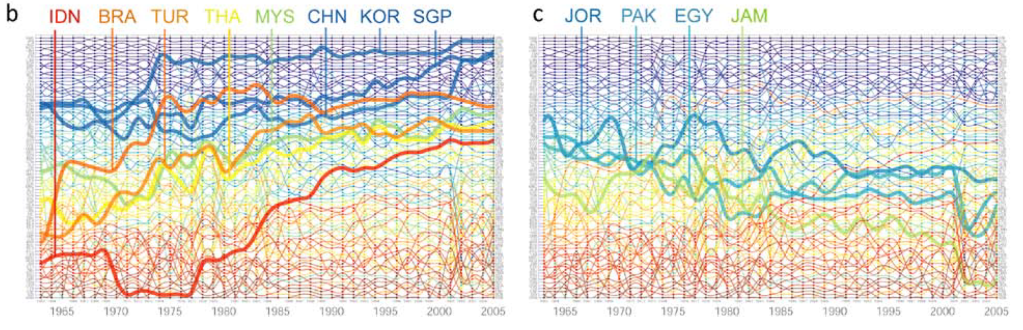
But there was a difference. Singapore, China and Korea progressed while remining in the top one-third of the ranking. Further he states that the productive structures in Singapore, Korea and China were “quite complex” in the 1960s, so the “income of these countries” eventually caught up to “the complexity of their economies”. According to Hidalgo, Deng Xiaoping’s reforms unleashed “an economic power that was already latent in China”. And further, that instituting the same reforms in countries with less “sophisticated productive structures” would not have the same effect. This implies that policies cannot be transferred from one country to another – very similar to Michael Porter’s tailored strategies.
Of course, these results cast doubt on an oft-repeated story in Singapore which claims that Singapore was a “basket case in the 1960s”. I never believed that story because Singapore was a trading hub much before the 1960s and so it had banking and insurance to support trade. And it had light manufacturing skills since it had a tin-processing industry as well as a (pineapple) canning industry. But much before that it was a kampong (village) – a fishing village. So how did it get from being a fishing village to having a “quite complex” production structure in the early 1960s?
Hidalgo states, that Indonesia, Brazil and Turkey had “primitive productive structures” in the 1960s. But at the same time, Indonesia appears to have made great strides in improving its capabilities since the 1970s, what explains this and how was it achieved? Is that not better than Singapore since Singapore started at a better place than Indonesia?
For countries like Pakistan and Jordan, which have fallen behind, Hidalgo states that “this does not necessarily imply that that these countries have not made any progress”. At least in relative terms they have fared quite poorly. Have they lost their innate capabilities? Have their production structures become more primitive? In fact, more recent data from the Observatory of Economic Complexity indicate that countries like Canada and Australia have also fallen in the economic complexity rankings. Canada was down from 15 to 30 between 1998 and 2023, Mexico was ranked at 25th place in 2023. Australia was down from 27 to 75 between 1998 and 2023. How are capabilities maintained, accumulated or lost? The capability-based complexity theory or other mainstream economic theories provide no satisfactory answers.
While it is clear, and by no means a new insight, is that the process of economic growth and development involves structural change, or what Michael Porter calls consistent upgrading. Complexity theory has few if any policy prescriptions to offer. Rodrik and Hausmann (2006) acknowledge the need for industrial policy and admit that it is “hard”. It cannot be broad based or sector neutral and involves “… the provision of inputs that are specific to subsets of activities”. But that is really all they have to say. It needs to be specific, since complexity theory is about products, so capabilities are product-specific, and some may be transferrable to nearby products which a country is presently not good at exporting. In Micheal Porter’s framework, the focus is on clusters. Rather than moving from one product to another, countries move from one cluster to another. Capabilities are cluster-specific, and some may be transferrable to emerging neighbouring clusters. There are some broad similarities between the two approaches, but Porter’s advantage is that his diamond-framework provides a tool for cluster diagnostics. Porter also acknowledges that clusters decline and may eventually disappear, so industrial policy involves not only trying to develop new capabilities but managing declining industries/clusters/products.
Much has been written in the U.S. about the so called ‘China Shock’ which led to the decline of some manufacturing industries (e.g. furniture, toys etc.) in the mid-west, but those authors have nothing to say about structural adjustment policies or whether the state and/or federal governments did anything to help workers to adjust, perhaps by providing subsidized skills training or otherwise assisting them in finding new positions in other industries. After all industrial policy is about assisting or facilitating the process of structural transformation. This involves moving public funds and support from less productive sectors to more productive sectors and if need be, killing unproductive projects. It is not about saving existing jobs but creating new ones and assisting workers to move from one industry to another.
Industrial policy is not about blaming countries you love to hate, or hindering their economic development, banning their companies, imposing tariffs and export controls, but about actively developing and improving domestic capabilities and facilitating structural transformation. Capabilities are neither innate nor static; they have to be nurtured and developed; both the private and public sectors have to invest in training and education. Otherwise, how could a kampong of yesteryears have transformed into the Singapore of today? There is a path forward for the nice Indonesian neighbours. They are just not an innovation driven economy yet. For proven examples of sound and successful industrial policy countries will have to look East, to Japan, Taiwan, South Korea, Singapore and China.
Methods
BACI trade data are available for over 180 countries and over 5000 products, but many countries and products have to omitted in calculating the product complexity index (PCI) to eliminate outliers, or countries that hardly trade or products that are hardly traded
The Atlas of Economic Complexity and the Observatory of Economic Complexity (OEC) use different cut-offs. In order not to repeat the exercise, I use the OEC list of countries and products a starting point since the OEC is more transparent and shares its data.
In the first step, I started off with OEC’s list of 132 countries and 3209 products (6-digit HS 2017). I had to expand the list of products since some products on the LCT and ENV lists were not included in the 3209 OEC products. After including the missing products, I had 3242 products. I used these to make a PCI for the years 2017-2023. I normalised the PCI using the z-norm and min-max norm.
For 2023, the correlation between my PCI and the OEC PCI is 0.9646
I also use a confusion matrix to compare terciles of my results with that of the OEC. In other words, I divide my PCI into top one-third, middle one-third and bottom one-third or high, medium and low complexity to assess how that matched with the OEC rankings. I got a matching percentage of 88.36 percent.
In the second step, I calculated the index of revealed competitive advantage (RCI) but here I only keep countries which have an RCA>1 in at least 10 products in any given year in the sample. This is conservative given that the list of LCT goods has 124 products and that of ENV goods has 221 products. This is how I end up with less than 132 countries and with a different number of countries for the two GCI rankings.
Sources
BACI balanced trade database (6-digit, HS 2017)
The Atlas of Economic Complexity
The Observatory of Economic Complexity (OEC)
Mealy, P., Teytelboym, A., Economic complexity and the green economy, Research Policy, Volume 51, Issue 8, 2022,
Hidalgo, C. A., The Dynamics of Economic Complexity and the Product Space over a 42 year period, CID Working Paper No. 189, Harvard Kennedy School (2009).
Hidalgo, C.A., Hausmann, R., The building blocks of economic complexity, PNAS 106 (26) 10570-10575, (2009).
Rodrik, D., Hausmann, R., Doomed to Choose: Industrial Policy as Predicament, 2006.

Leave a comment