Environmental Goods
Economic growth is about structural transformation. Structural transformation involves raising labour productivity through the transfer of resources from low productivity activities to higher productivity activities. This involves diversifying and upgrading production and becoming ‘good at’ exporting more sophisticated or more complex products. One way to visualize this is to see how countries traverse the product space and in doing so, diversify their export basket.
Hidalgo et. al., who introduced the product space use the metaphor of a forest to describe the product space. The forest has trees which represent the various products. It has a central dense part and a peripheral sparse part. In the central part products (trees) are more proximate to each other and in the sparse part they are further away. Monkeys are firms, which can ‘jump’ to higher valued (more complex) products. It is easier for monkeys to jump from one tree to another in the dense part of the forest. Capabilities are more easily transferred to products that are nearby than to those that are further away.
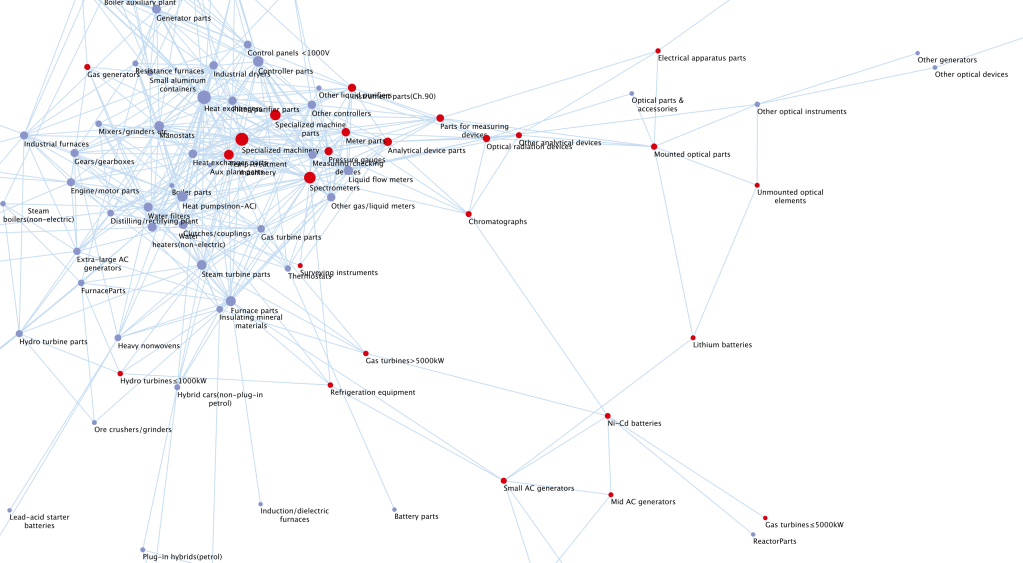
This is a snapshot of Singapore’s position in the product space for environmental goods in 2023.
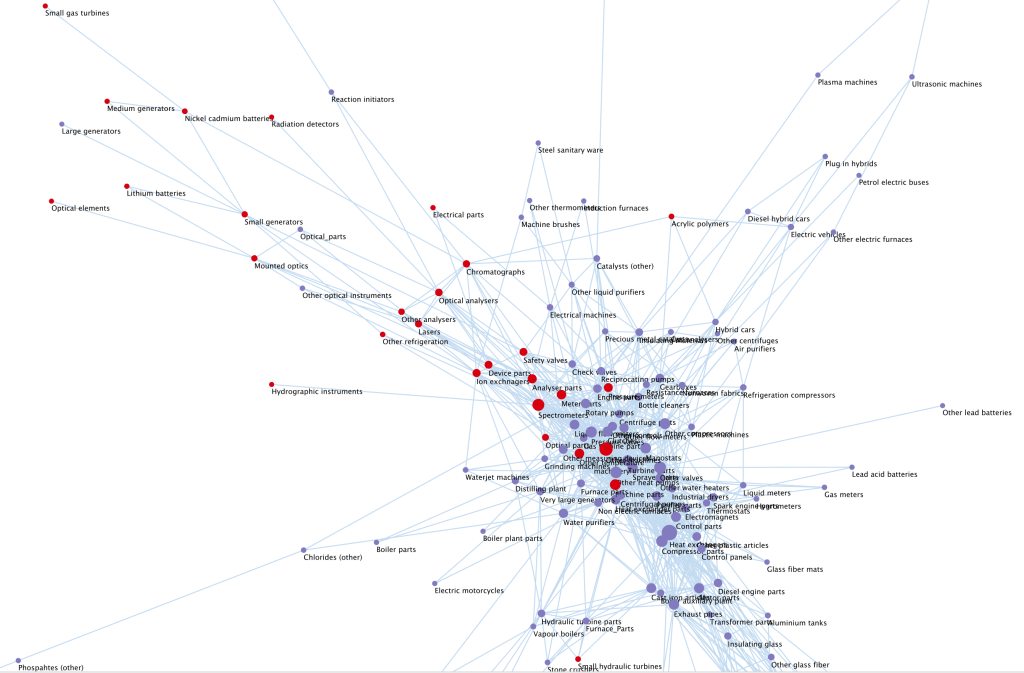
The size of the nodes (circles) is degree centrality, connections between nodes (edges) are weighted by Hidalgo’s measure of proximity. Degree centrality measures how many other nodes a particular node is connected to. Nodes in the center are generally larger than those at the periphery, implying that products in the dense part of the network are connected to many other products relative to those at the periphery. Singapore (red nodes) is ‘good at’ exporting many products in the center of the product space and it has many other products (purple nodes) to ‘jump to’, sometimes referred to as the ‘open forest’. Strictly speaking this does not mean Singapore does not export any of the products in the ‘open forest’, it not yet ‘good at’ exporting them, or the index of revealed competitive advantage (RCA) for these products is less than 1. In fact, Singapore exports all but two of the over 220 products included in the IMFs definition of environmental goods.
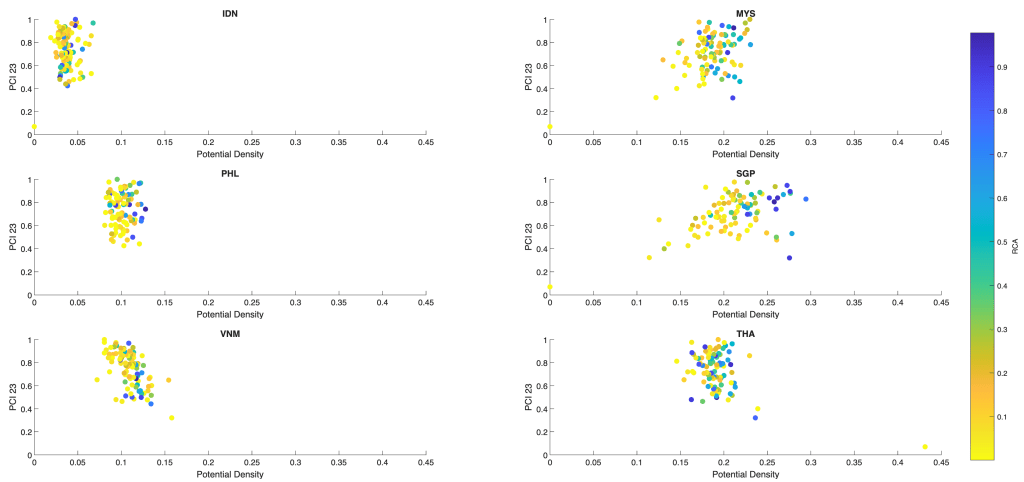
To upgrade, Singapore should look to transitioning to more sophisticated products. The next figure shows how ASEAN countries are positioned for moving to more sophisticated products. The horizontal axis measures potential density or the adjacency to products that countries are presently ‘good at’ exporting – a higher number is better. The vertical axis measures the product complexity or sophistication – again, a higher number is better. This means that an upward sloping plot is better than one that appears vertical, but vertical is better that backward sloping. An upward sloping plot shows that more adjacent products are also more complex. A vertical plot indicates that regardless of complexity, products are roughly equally adjacent. A backward sloping plot implies that adjacent products are low complexity products and more sophisticated products are further away, or more difficult to jump to. The colour bar measures the RCA, more blue (darker is better) is better than more orange and yellow. Blue indicates an RCA closer to 1, or that a country is not yet ‘good at’ exporting a particular product but it is very close. Yellow indicates that the RCA is closer to zero.
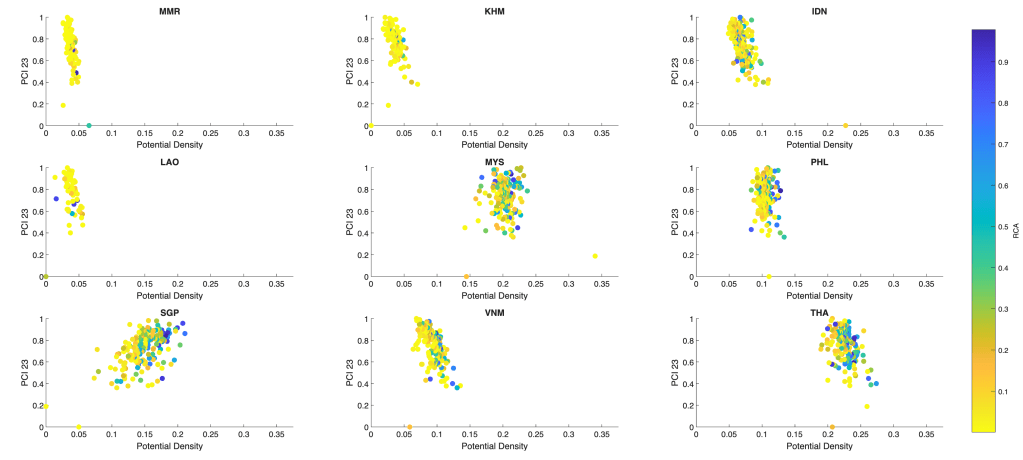
Singapore is well positioned, since the graph has an upward slope and there are many blue dots in the top right. Myanmar and Lao are examples of vertical graphs or low potential density (roughly clustered around a narrow range: 0.03 to 0.05) regardless of complexity. These economies need to make big jumps to develop, which is difficult. And even if they do jump, it will take them quite a bit of time to become ‘good’ at exporting these products since the RCA is low (yellow plot).
Economic development is a hard slog and takes time. This why in his work on competitiveness, Michael Porter calls for continuous upgrading. The graphs for Thailand and Vietnam are sloping backwards, indicating that more complex products are further away, and it easier to jump to products with low sophistication. But Thailand has many more blue dots than Vietnam, which is good because the RCA is higher indicating that Thailand can upgrade relatively quickly and become ‘good at’ exporting a number of products with varying complexity.
Malaysia is an interesting case, because although the graph looks vertical it is more spread out (horizontally) than Myanmar. So, while Myanmar has to make bigger jumps, and has less diverse capabilities than Malaysia. Malaysia has a broader set of nearby options of varying sophistication – it has more choice.
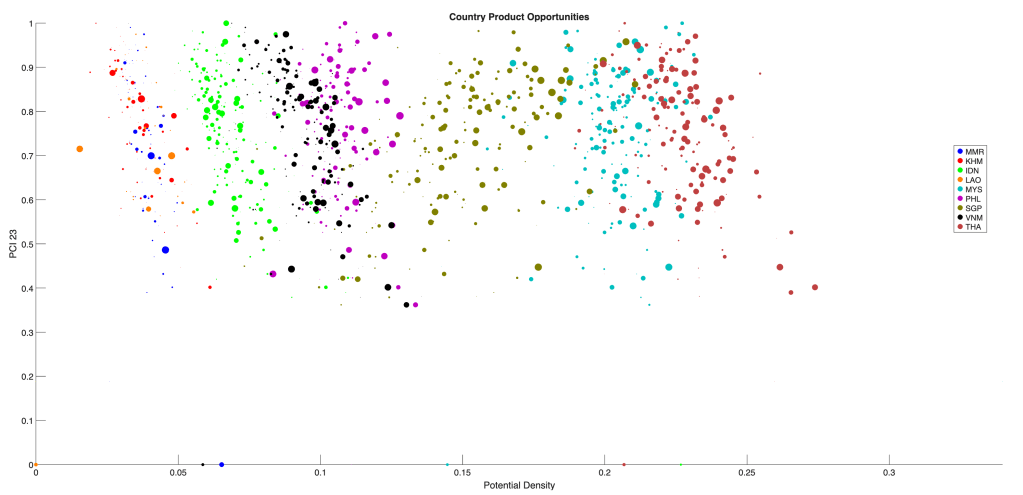
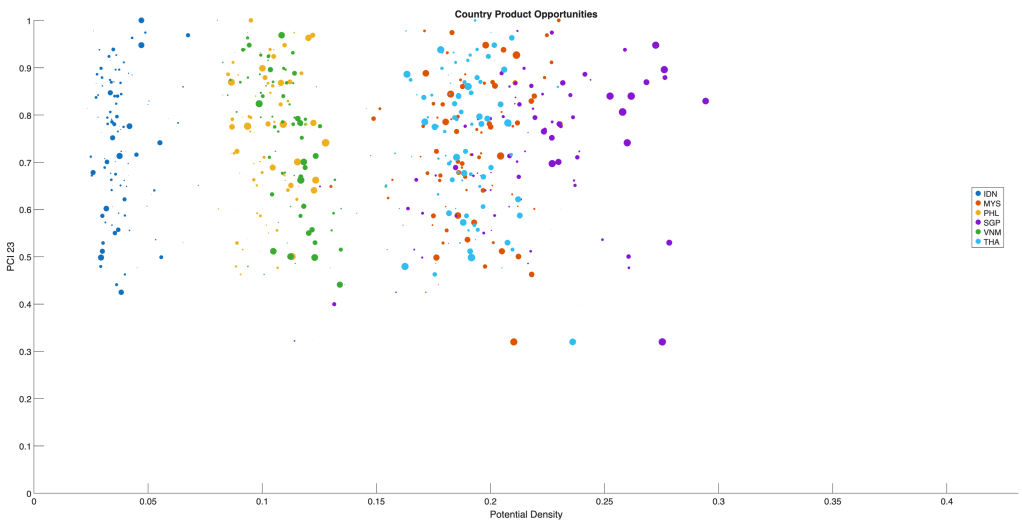
The following exhibit puts all nine economies together and provides an alternative visualization of the same information. The horizontal and vertical axes are the same, but RCA is represented by the size of the dots (or bubbles). Cambodia, Lao and Myanmar are at the extreme left (low potential density or very few products nearby). Indonesia, Vietnam and Philippines are next. Thailand and Malaysia are at the extreme right and Singapore’s open forest is upward sloping and spans many ASEAN economies.
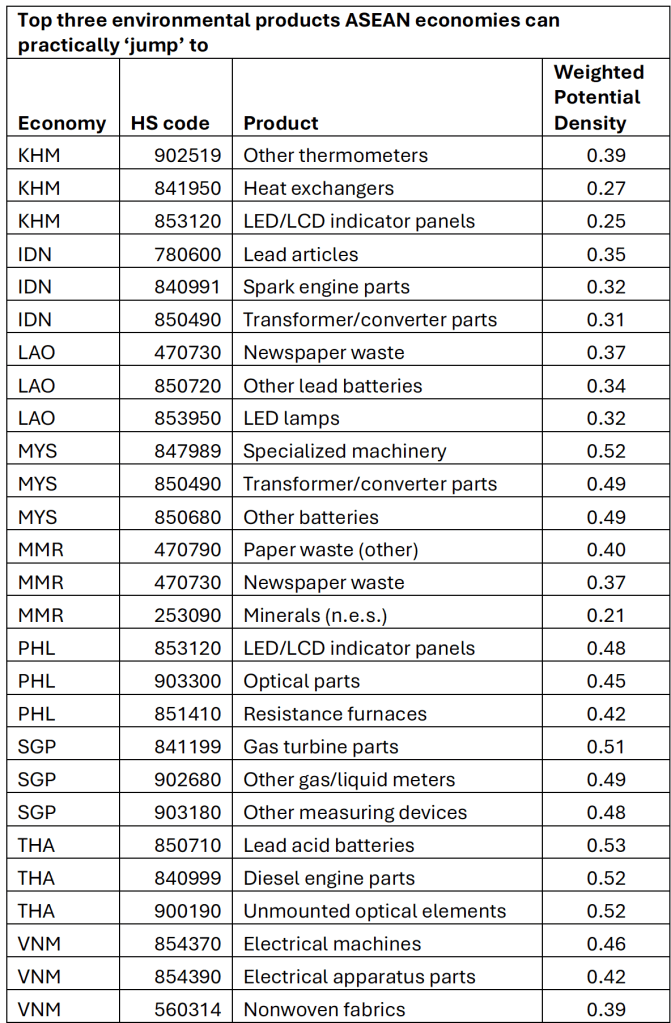
Which are the top three products that ASEAN countries should consider jumping to?
There are two theoretical answers. The first ranks products according to potential density or capability adjacency. The second approach ranks products on the basis of highest opportunity gain, ‘opportunity gain’ which incorporates the complexity of a product as well as its potential density. Both these approaches identify jumps, but these are theoretical or conceptual jumps.
Consider Cambodia, according to the first approach, it should jump to Anhydrous Ammonia (highest potential density). The RCA for this product is 0.0002, so Cambodia is practically not exporting it. According to the second approach, Cambodia should jump to Ceramic Capacitors. This product has a marginally higher complexity and RCA than Anhydrous Ammonia. But an RCA of 0.001 is also practically the same as not exporting.
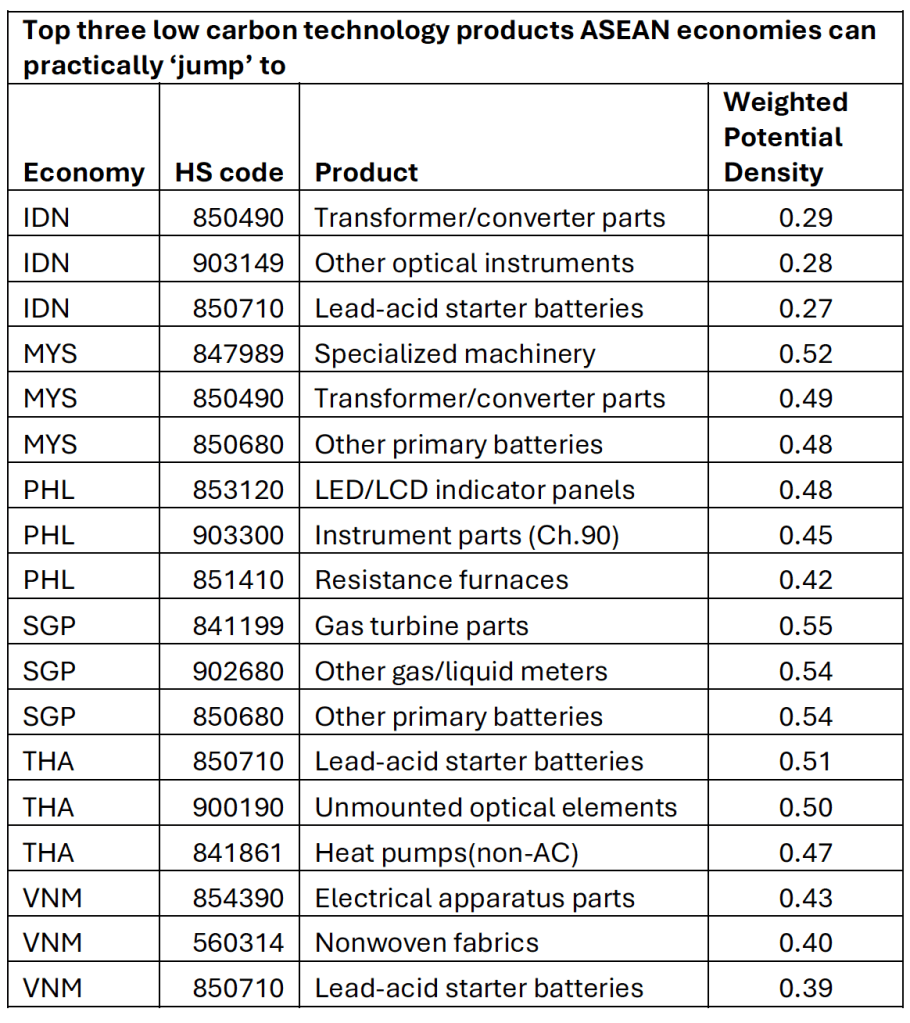
I use a slightly different approach which I think of as a ‘practical’ jump. It is a weighted average of the RCA (40%) and potential density (60%). The weights are arbitrary, but they rule out products with almost zero RCAs. Small practical jumps are better than aiming for something which is very far away from present capabilities. As Porter suggests, countries should upgrade or improve the productivity of existing clusters and explore new possibilities at the intersection of clusters. Results are provided in the following table.
Low Carbon Technology Goods
The same exhibits and tables for low carbon technology goods (without the prose).
The smaller ASEAN economies are not significant participants in trade in low carbon technology products.
Indonesia is at the extreme left (below), followed by Viet Nam and the Philippines, then Malaysia and Thailand, Singapore is upward sloping and crosses both Malaysia and Thailand.
Methods
Data are from BACI balanced trade database. HS 2017.
Product space is made using Cytoscape. The proximity cut-off is 0.5 for edge weights in order to keep the graph uncluttered.
Sources
Hidalgo, C.A., et al, The Product Space Conditions the Development of Nations. Science 317,482-487(2007).
Hausmann, R. & Hidalgo, C.A., 2008. A Network View of Economic Development. Developing Alternatives, 12 (1), pp. 5-10.

Leave a comment