The product space in the complexity literature (Hidalgo, Hausmann and others) provides one way to visualize structural change. How does a country move across the product space over time? If it moves toward the center of the product space (dense part of the forest), then that is a good thing since it is moving to higher complexity products which are primarily manufactured goods and chemicals or ‘rich country’ type of goods. And since the forest is dense in the center, there are many more proximate goods to jump to in the ‘open forest’.
Teza provides an alternative interesting way to conceptualize and visualize structural change. One of the main differences between Teza and the complexity approach is that that latter excludes some of the available information on exports. The complexity approach only considers products that a country is ‘good at exporting’ (or products with an index of revealed competitive advantage > 1) whereas Teza considers all exports of a country. There are important similarities as well. Both approaches rely on diversity and ubiquity. A diverse export basket is good because it reflects a broad set of capabilities. But that is only half the picture. Diversity can come from size or population. In one of their articles, Hidalgo and Hausmann compare Singapore and Pakistan because they exported a similar number of products in 2000. They found that Singapore was connected to diversified economies through “nonubiquitous” products. Pakistan on the other hand was connected to poorly diversified economies through ubiquitous products. They attribute Pakistan’s diversity to population and Singapore’s to capability. Hence the difference in income levels between the two countries.
Diversity needs to be combined with ubiquity or how ‘common’ a product is – how many other countries export it? If many do, then those capabilities are not highly valued as they are available in many economies. Lower ubiquity of products in the export basket reflects more specialized or sophisticated (and less widely available) capabilities.
The following figure does not adjust for ubiquity (see the next post), instead is shows the observed export structure of over 200 countries in 2023. ASEAN and selected Asian countries are labelled as are some others for comparative purposes. The horizontal axis measures the median export share of the export basket of a country. A left-ward movement represents diversification, and a right-ward movement represents concentration. The vertical axis shows total exports in billions USD (log scale) and the colours represent the number of (6-digit) products exported by a country in 2023. The blue line is a (log-log) regression line which uses data from countries which export less than one thousand products (darker blue dots). These countries export few products, and their export baskets are not very diversified. Teza calls this the ‘poverty trap line’, but I avoid using ‘income related’ terms to prevent confusion. The figure only shows what can be observed from export data. [Please open all images in new tabs].
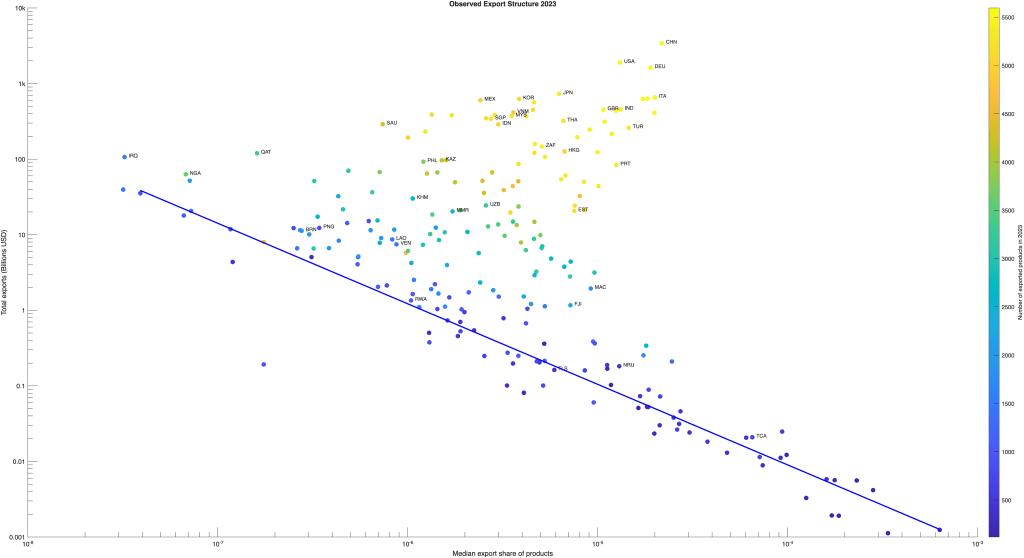
Oil and gas exporters lie on the left of the figure (on and above the blue line). They include Libya, Iraq Nigeria, Qatar and Brunei. These countries export few products with high dollar values, but they do export many other products as well, which have very small export shares, so the median share is towards the lower end of the scale.
Small-island nations such as Nauru (NRU), Turks and Caicos Islands (TCA) and ASEAN’s newest member Timor-Leste (TLS) lie on and around the blue line towards the right of the figure. Small land-locked countries such as Rwanda (RWA) are also on the blue line.
Other ASEAN countries lie above the line, and the colours show that a majority export more than a thousand products. Moving up and to the right there are Lao; Myanmar and Cambodia; the Philippines; and then Indonesia, Malaysia, Singapore and Vietnam in a group, not far from Mexico and South Korea – all diversified export-oriented economies; and finally, Thailand lies to the right of that group. India is close to United Kingdom. Towards the right, near (and around) Portugal and Türkiye are other European economies such as Austria, Poland and Spain. These economies have less diversified export baskets than the major ASEAN economies. China is at the top of the figure just above Germany and the United States. These three countries export nearly all of the over five thousand 6-digit products in the sample.
The next two figures (the second magnifies part of the first) show changes in the export structure of ASEAN and a few other economies between 1996 and 2023.
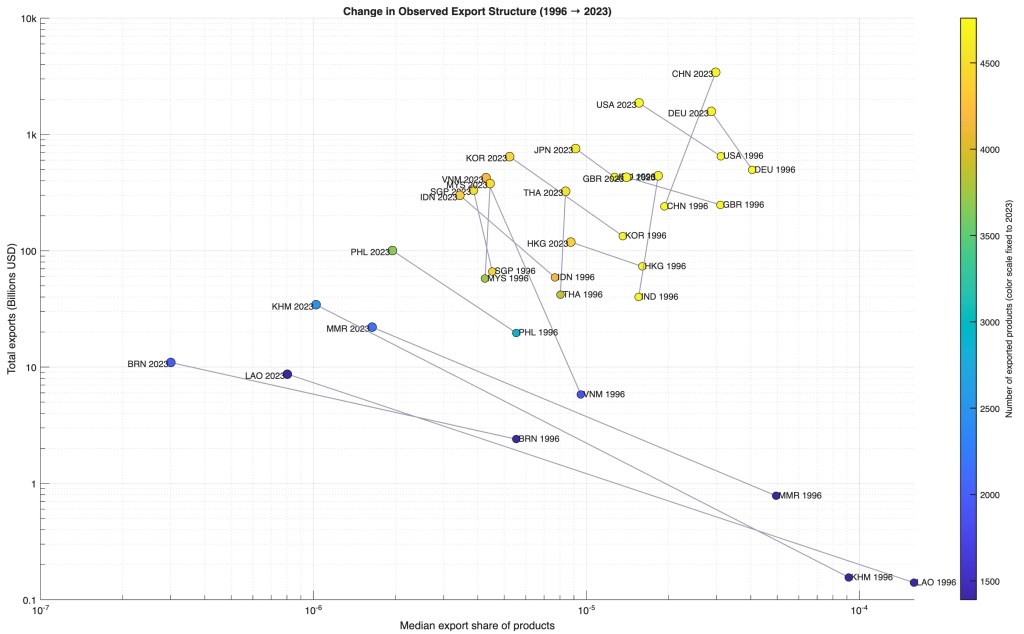

Some countries show more left-ward movement (relative to upward). These include Brunei, Cambodia, Lao, Myanmar and the Philippines. This represents diversification. Indonesia, Singapore and Vietnam have all moved up and to the left. This reflects increase in the value of exports (very high in the case of Vietnam) and diversification. Thailand and Malaysia have moved primarily in the upward direction and somewhat to the right, representing primarily increase in the value of exports with the export structure moving slightly towards more concentration. China and India also show similar patterns.
Changes in the export structure can come from specific polices directed towards the export sector, but they can also come more general pro-competitiveness policies. A recent example is the labour market reform in India. The government plans to implement four Labour Codes relating to wages, social security, pay-equity, industrial relations and occupational health and safety. These four codes replace 29 laws which had been on the books since the 1930s-50s. The new rules are expected to have a variety of impacts such as bringing workers from the informal to the formal sector and allowing MSMEs to adjust their scale. For various reasons, Indian firms operate at a relatively small scale, particularly in labour intensive industries. In addition to increasing labour market flexibility, the new rules will allow firm size to increase and that is likely to improve both productivity and competitiveness. These changes are likely to show up over time in India’s export structure.
Notes
Mealy et. el. 2019 examine the impact of choosing alternative RCA (index of revealed competitive advantage) thresholds (other than 1 as is done in the work of Hidalgo). In particular they examine the correlation between the Economic Complexity Index of a country and change in per-capita GDP. They find that these correlations are highest between thresholds of 0.5 and 2.
The figure (observed export structure 2023) is similar to figure 2(e) in Teza.
Sources
Trade data are from the BACII balanced trade database.
2023 figure uses HS 2022 (6 digit)
1996-2023 figure uses HS 1996 (6 digit)
Hidalgo, C.A., Hausmann, R., The building blocks of economic complexity, PNAS 106 (26) 10570-10575, (2009).
Penny Mealy et al., Interpreting economic complexity. Sci.Adv.5, eaau1705 (2019).
Teza, G., Caraglio, M. & Stella, A.L., Entropic measure unveils country competitiveness and product specialization in the World trade web. Sci Rep 11, 10189 (2021).
The Economic Times: New Labour Codes: What the government promises and why MSMEs are watching closely. Nov 26, 2025.

Leave a comment