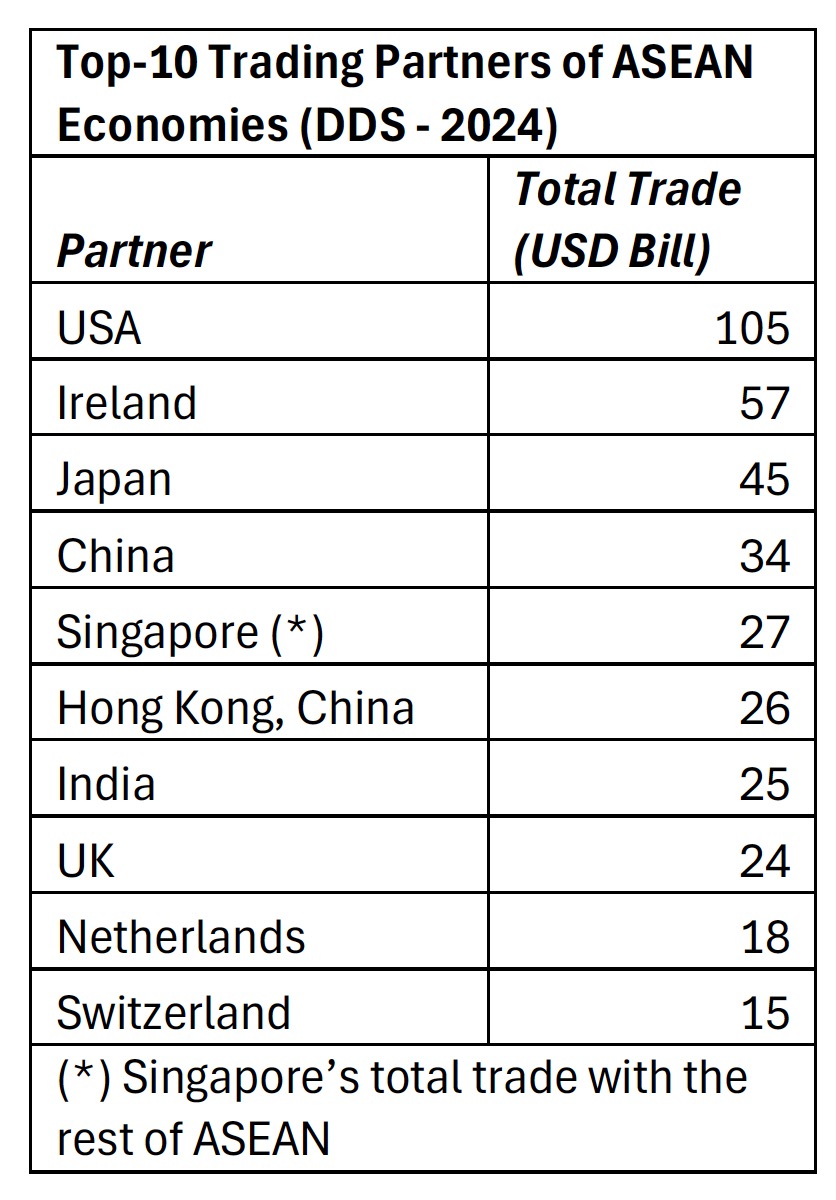
I provide here, some estimates (see methodology), of bilateral digitally delivered/deliverable services (DDS) trade for ASEAN. The following table shows the top-10 trading partners (based on total DDS trade). Of course, trade with Ireland is likely a conduit for more trade with American companies, many of which have affiliates there for tax and other reasons.
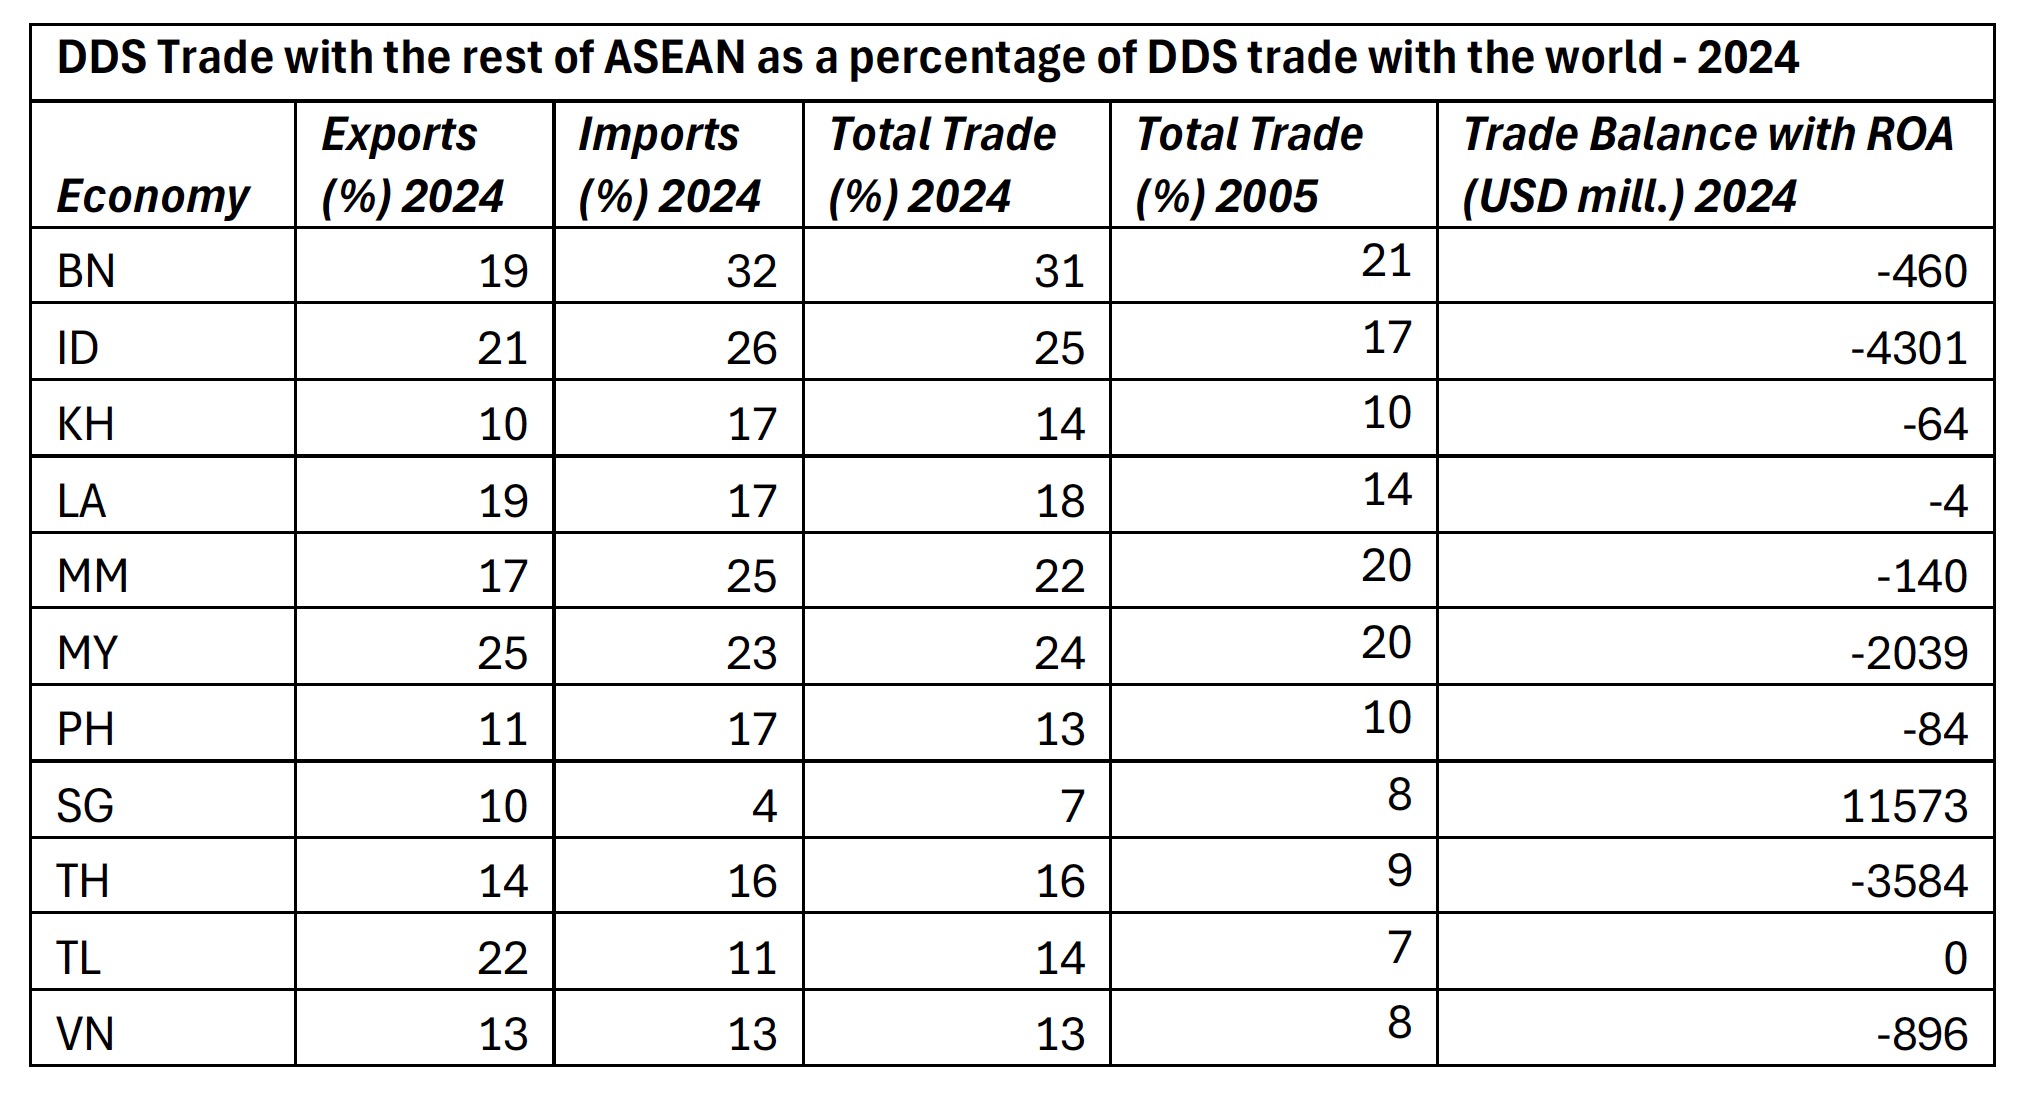
In 2024 ASEAN’s total DDS trade with the world was USD 546 billion and total Intra-ASEAN DDS trade was USD 60 billion (or roughly 11%). All other ASEAN countries are net importers as Singapore, which is a hub for DDS trade in ASEAN, is the only country with a positive trade balance with the rest of ASEAN. Singapore is also the least integrated with the rest of ASEAN. Comparing 2005 with 2024, (rest-of) ASEAN’s share in total DDS trade increased for all ASEAN countries except Singapore.
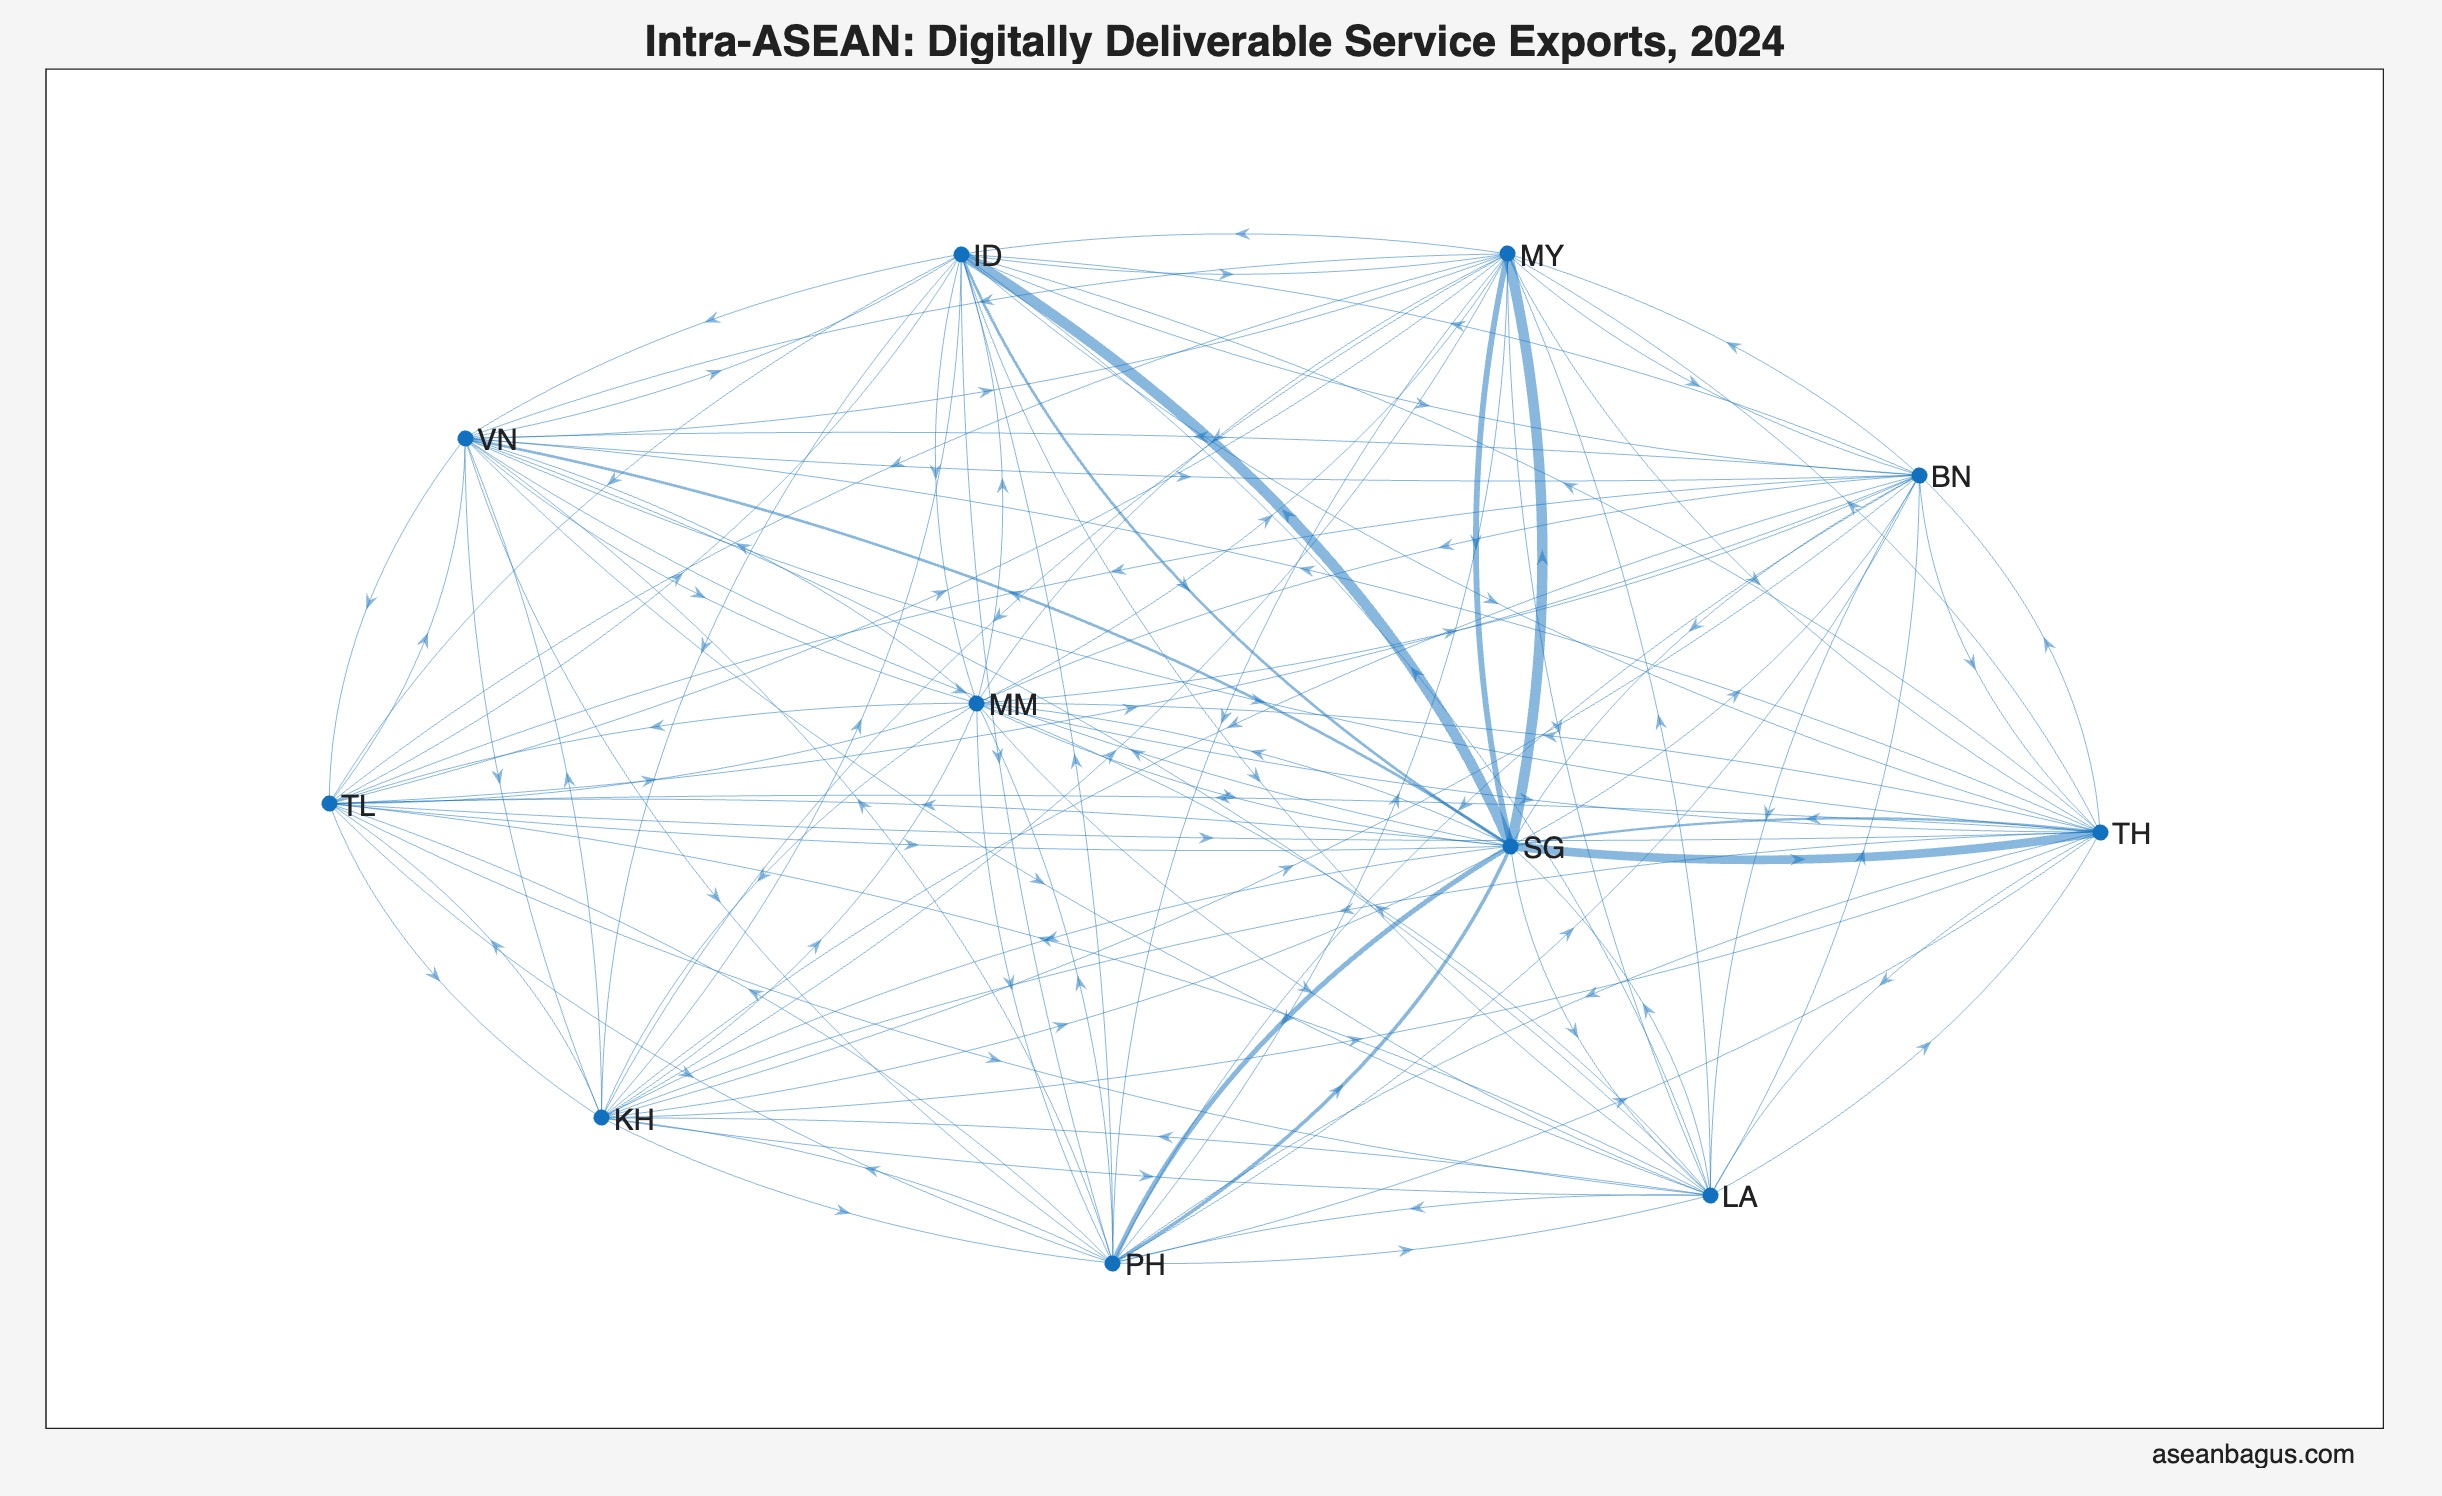
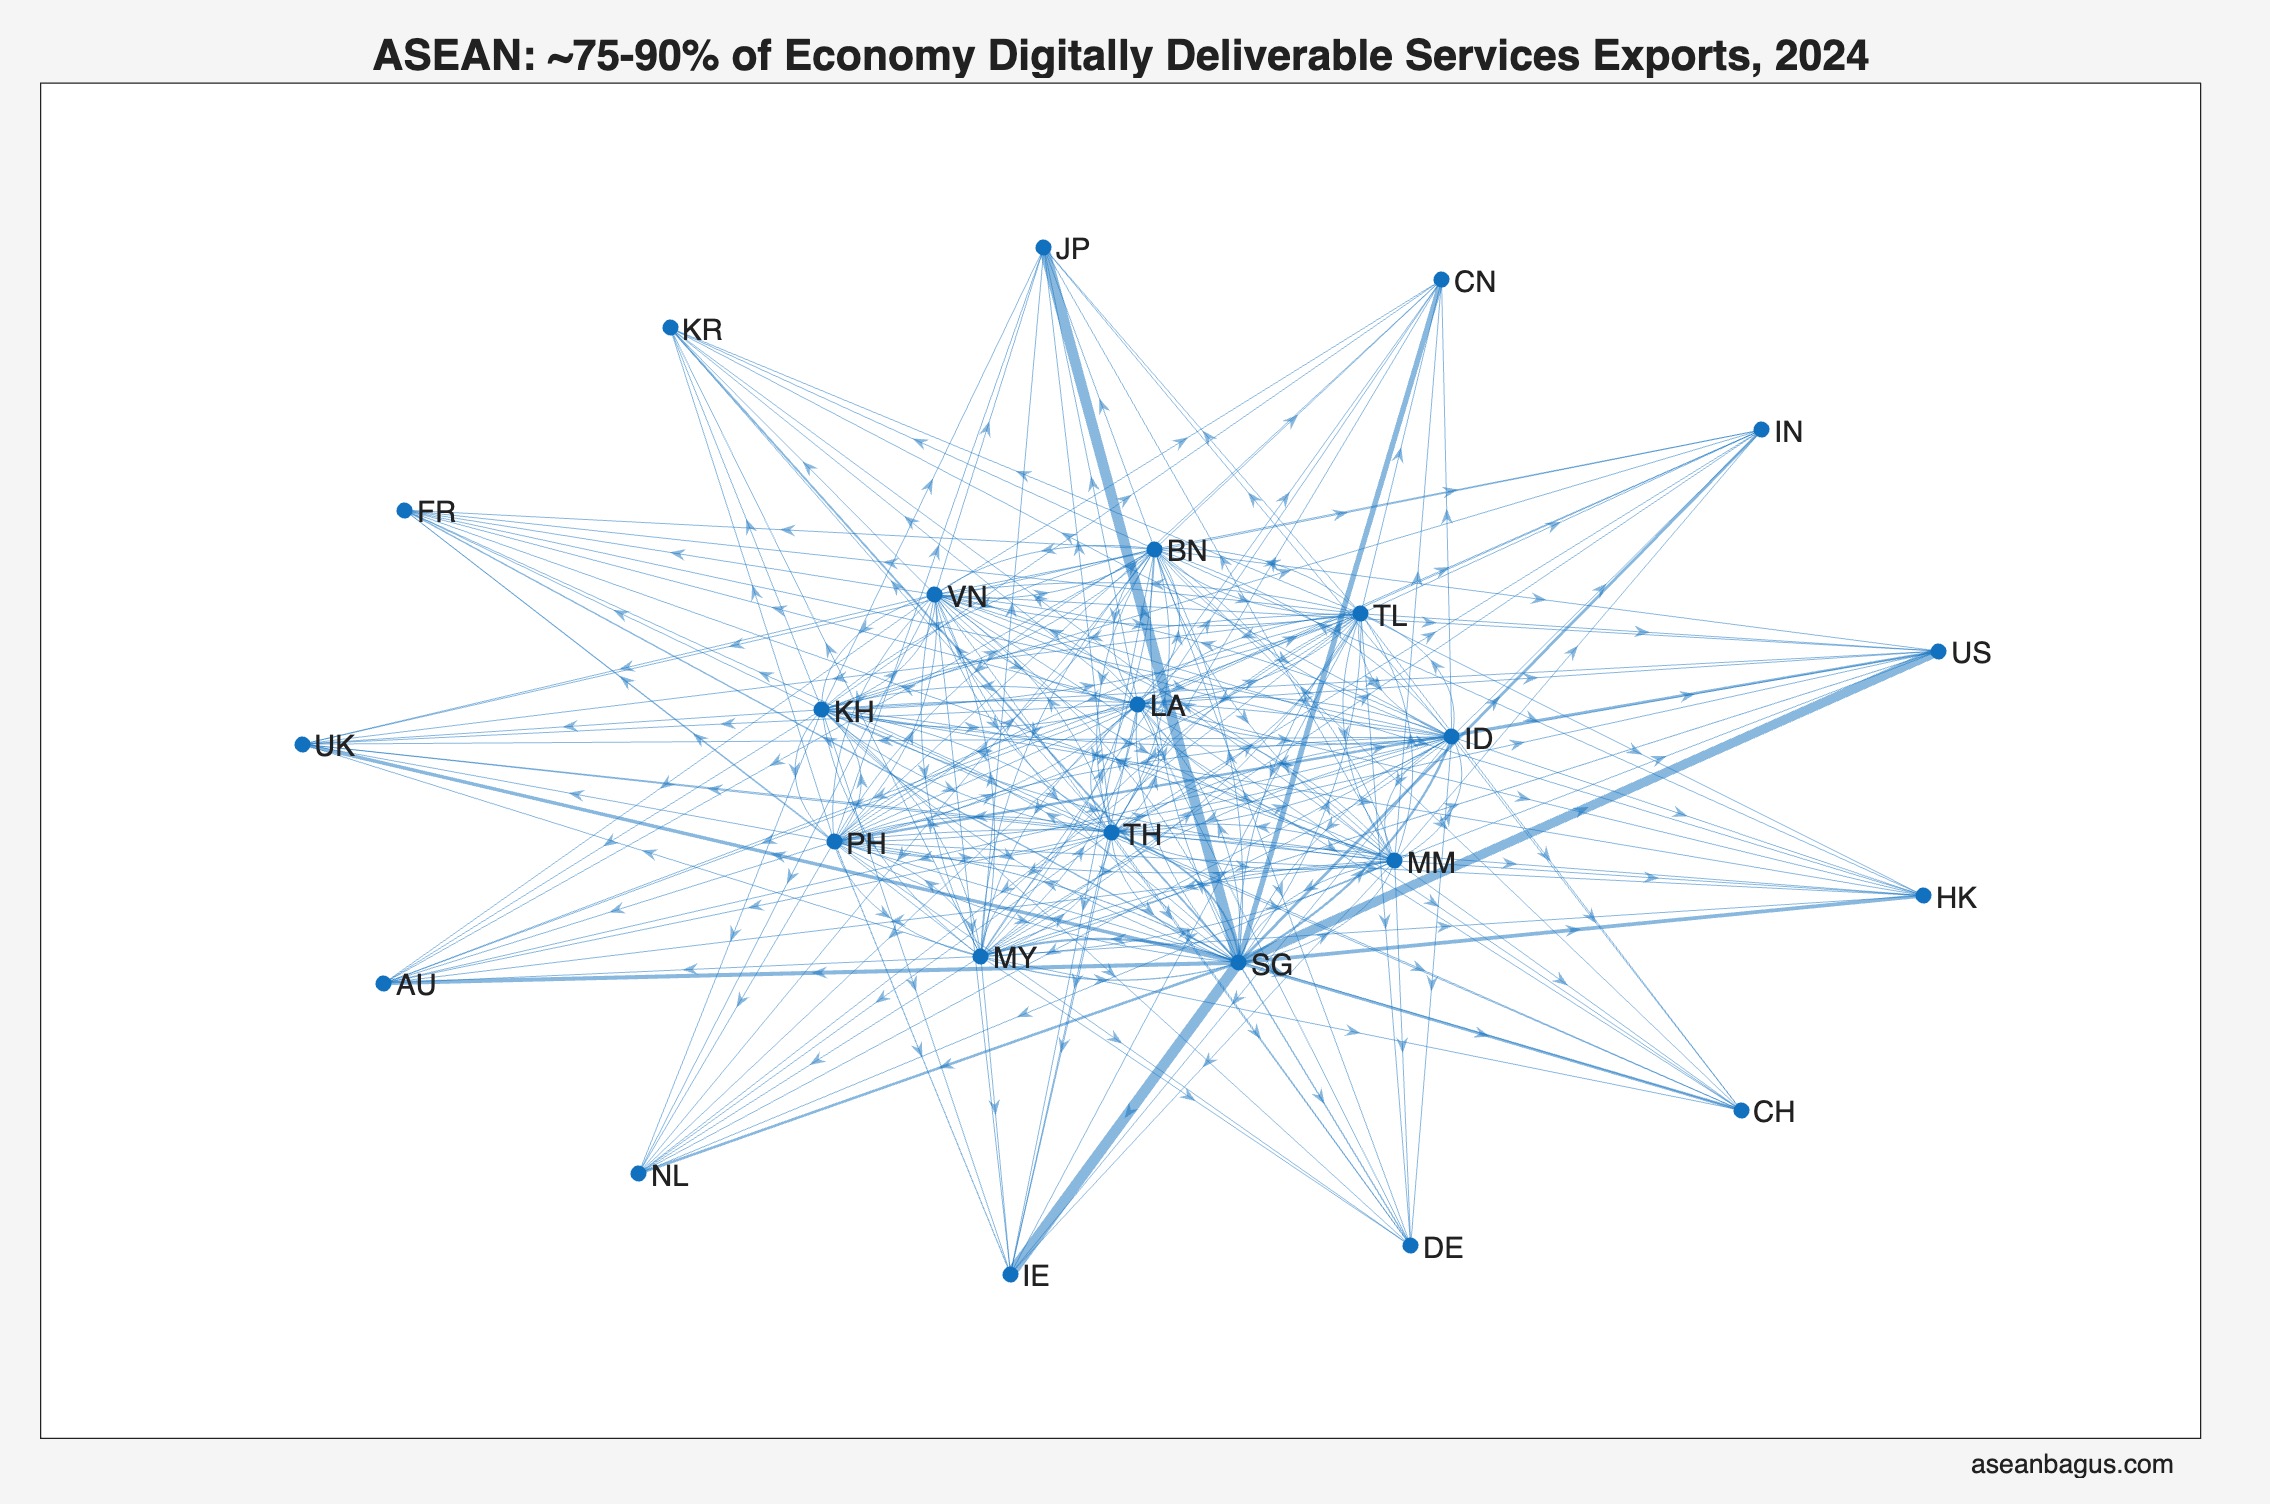
The following figure shows that most of DDS trade is between ASEAN-5. The smaller ASAEAN economies have a lot of catching-up to do (since BaTiS is a balanced database, imports mirror exports).
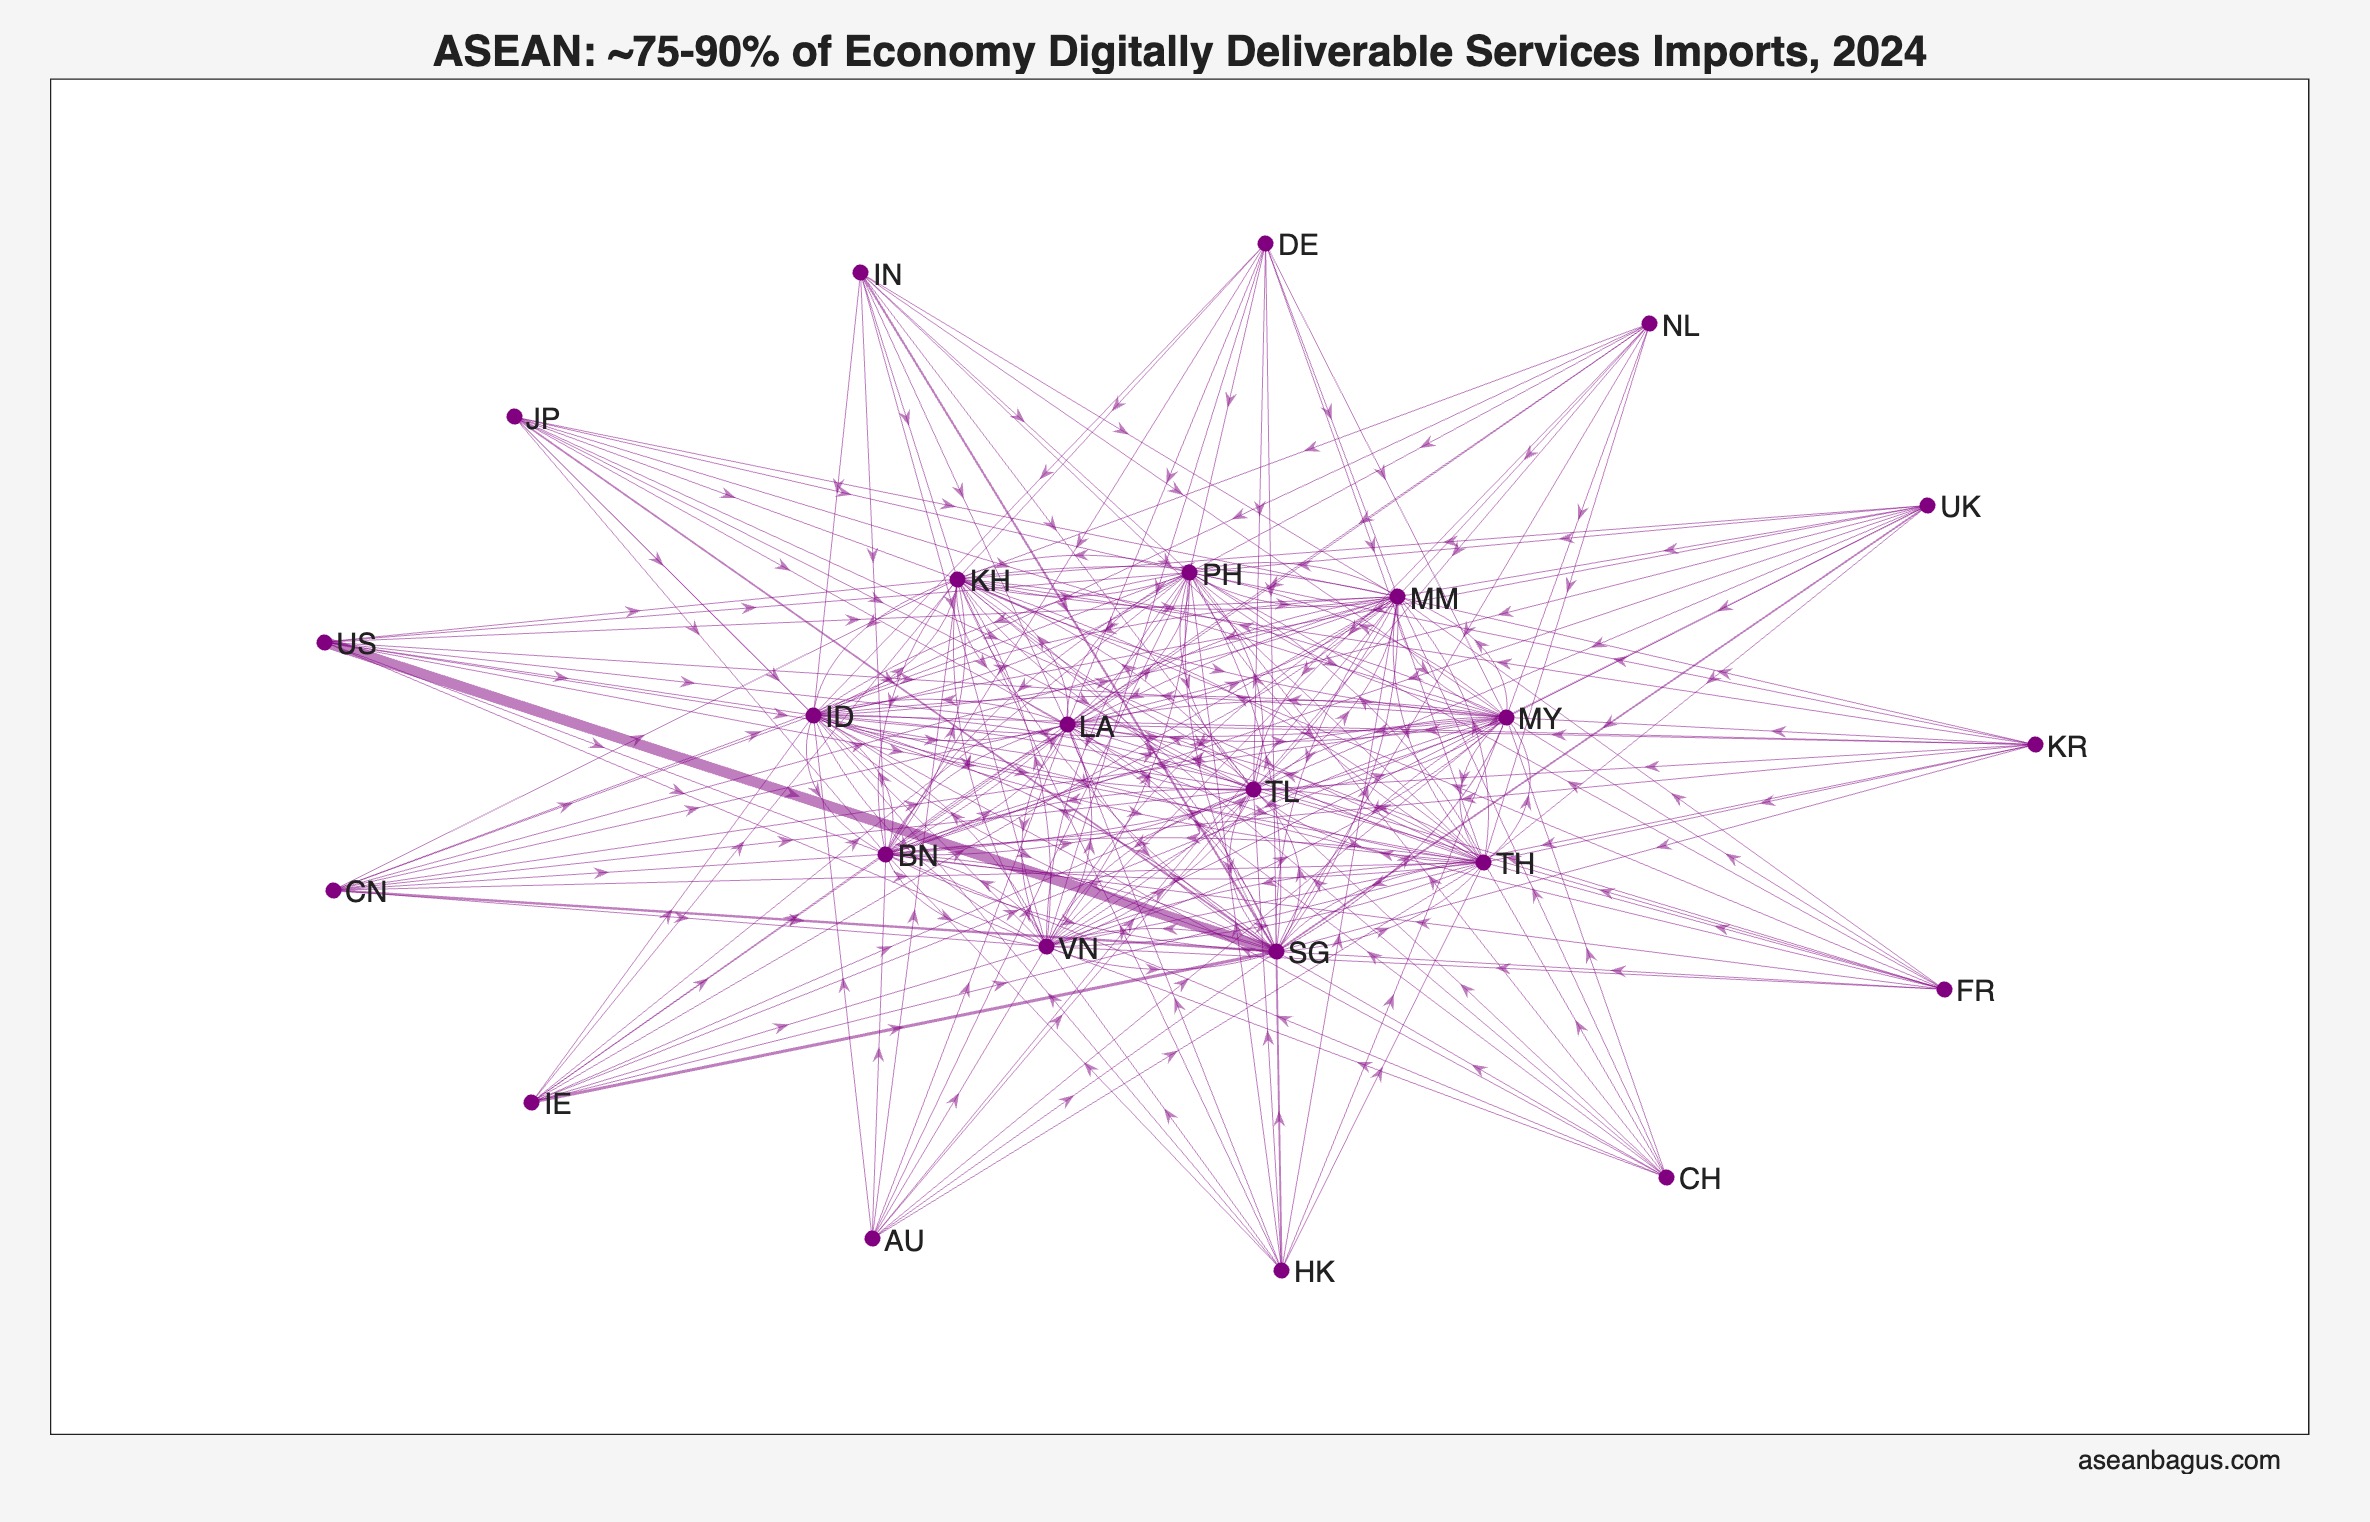
The next two figures show ASEAN’s trade with its major trading partners (based on total trade in 2024). This group of roughly 14-15 top trading partners (excluding ASEAN economies) has remained the same since 2005. DDS trade with these and ASEAN partners accounted for between 75 and 90% of any ASEAN economy’s total DDS trade in 2024.
In 2005 the UK had a more important role in Singapore’s DDS trade. Between 2005 and 2024, the UK was replaced by Ireland. Japan has been a net-importer of DDS from Singapore since 2007 and Singapore’s positive bilateral trade balance with Japan increased by roughly 400 times by 2024. In 2005, ASEAN’s DDS trade with India was higher than that with (mainland) China, that flipped in 2008. This is not surprising since India had been ‘looking East’ and ‘talking East’ but ‘acting West’.
Sources
WTO-OECD Balanced Trade in Services Database – BPM 6 (BaTiS).
WTO: Trade in services annual database.
WTO: Trade in services by mode of supply dataset (TiSMoS).
WTO: Digitally delivered services dataset (DDS).
IMF-OECD-UNCTAD-WTO Handbook on Measuring Digital Trade, second edition, 2023.
Methodology
In my previous post, I discussed the relationship between TiSMoS and DSS for ASEAN countries. With the exception of the Philippines (exports), TiSMoS and DDS are virtually identical. Those databases along with Annex D of the Handbook and annual data on trade in services show that there has been an update in the methodology outlined in Annex D since 2020 (what I call the ‘Covid-bump’) which has yet to be made public. What follows may be treated as an unofficial update. I have used data for Singapore for the years 2019, 2020 and 2024 to verify the Covid bump and 2024 to ensure that the change made in 2020 still holds in 2024. TiSMoS data is available till 2022, after one needs a third source, which in this case is the WTO services trade database. The latter has been used to derive DDS exports and imports for Singapore. The following proportions (applied to total services trade) replicate Singapore’s DDS data for the years 2019, 2020 and 2024.
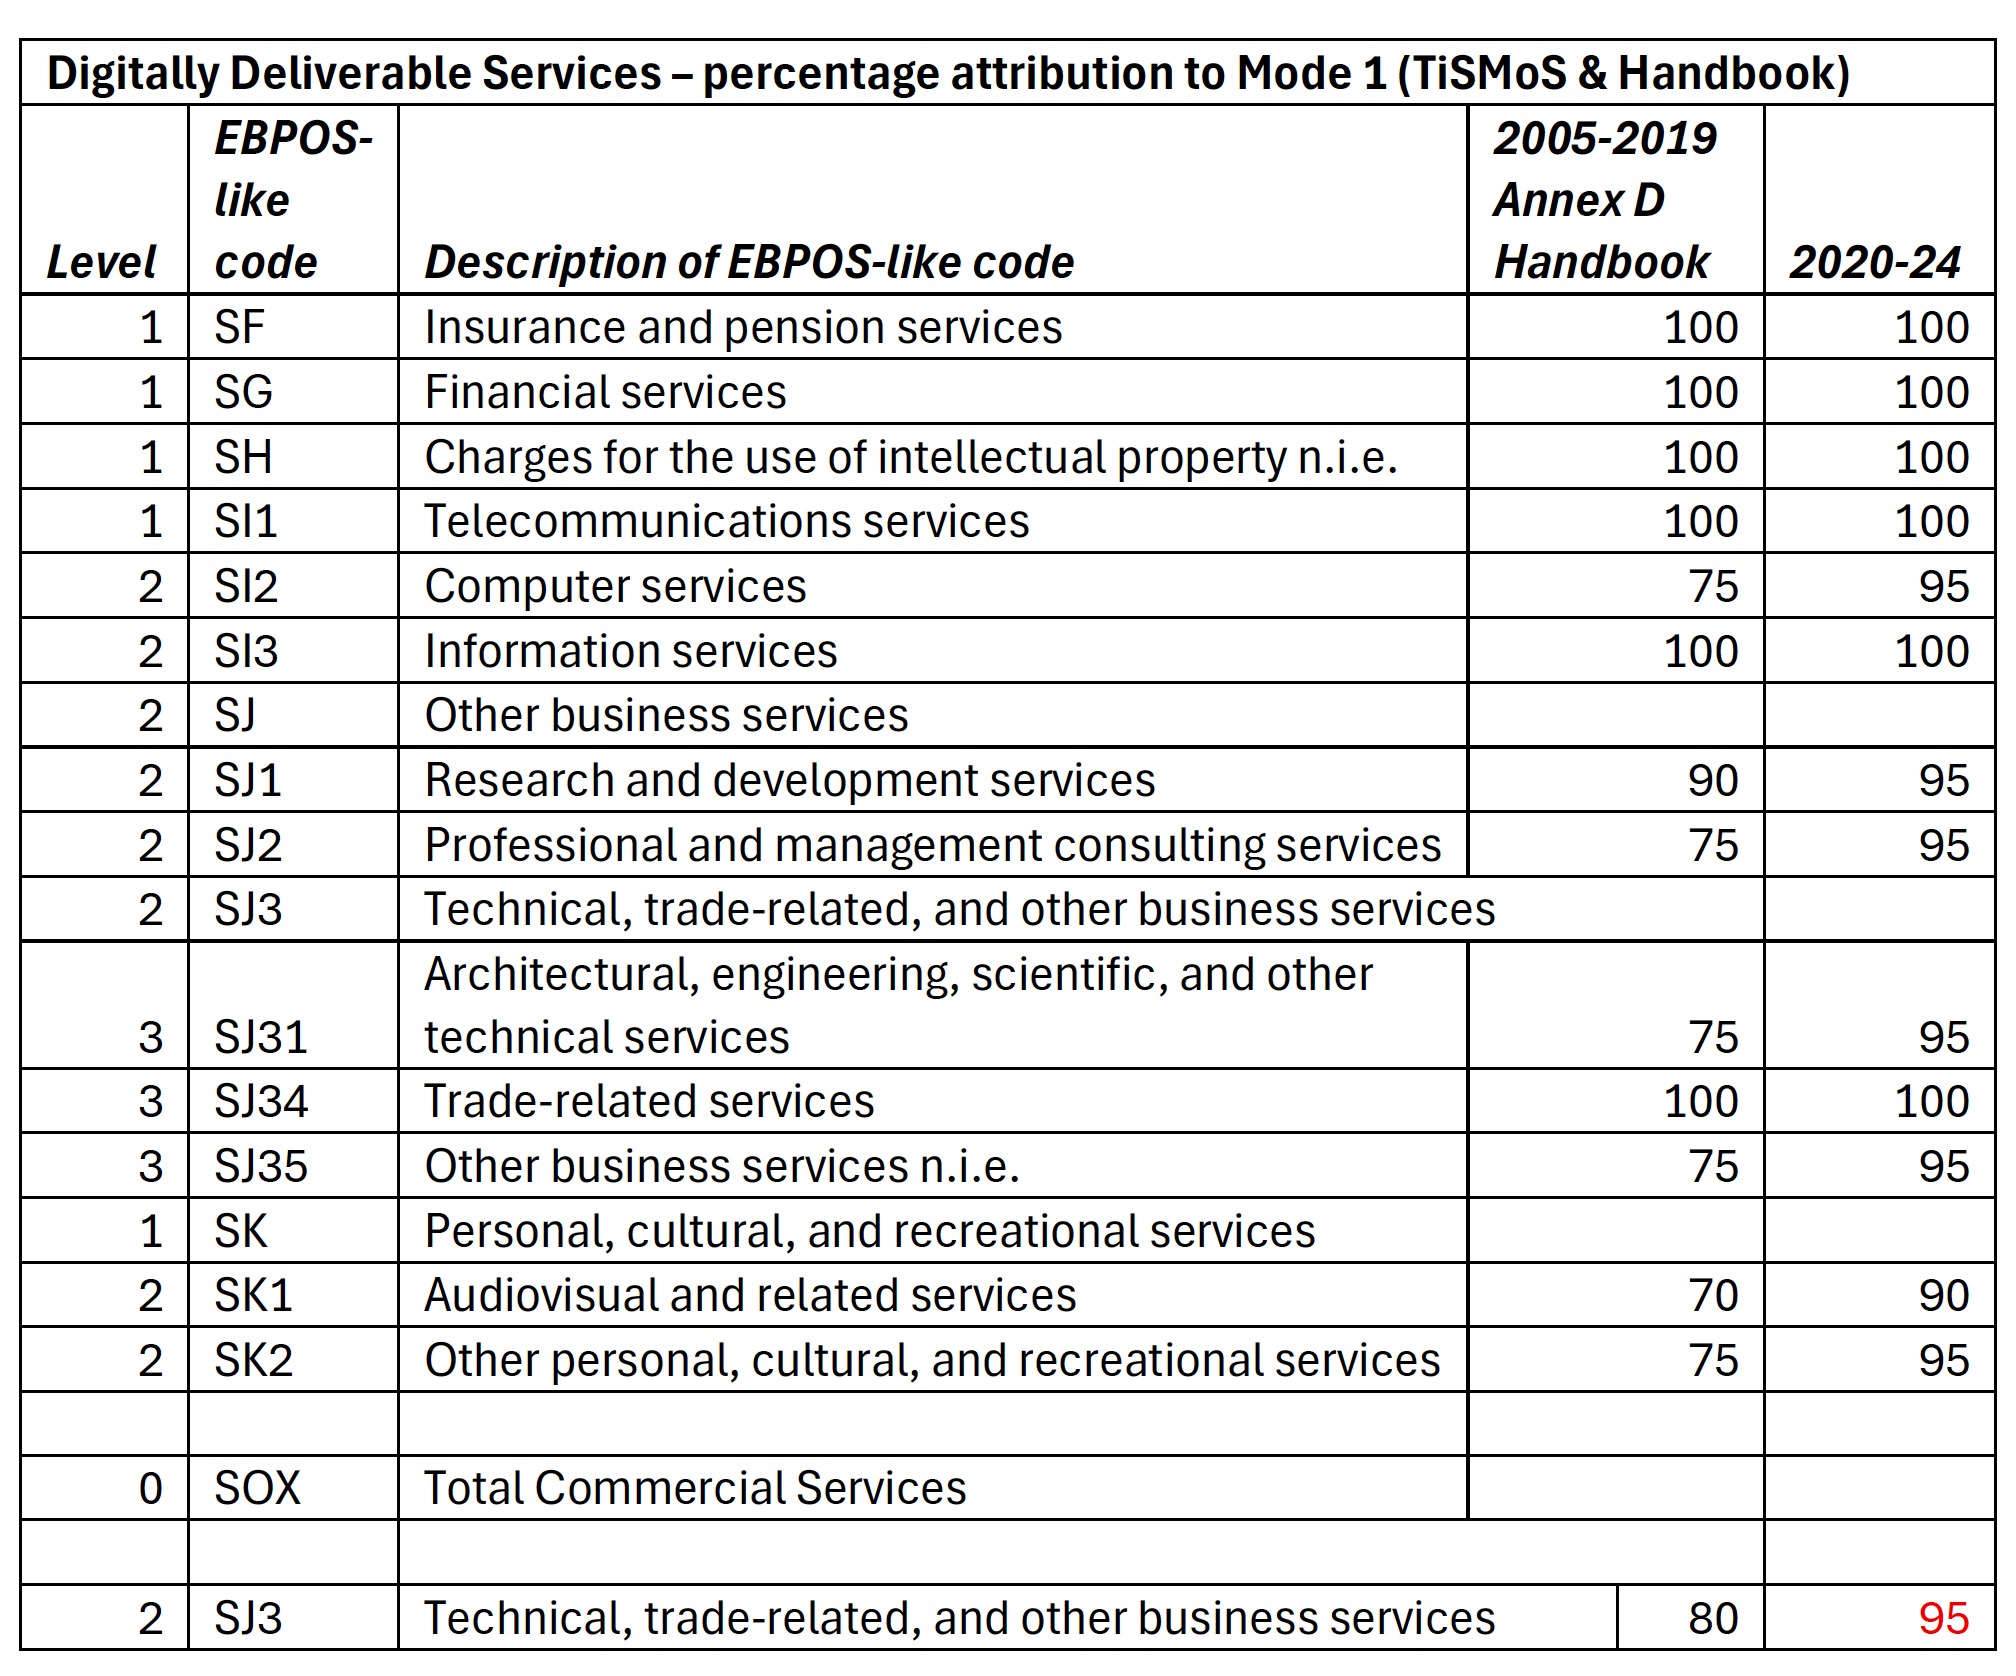
A few of these proportions cannot be directly applied to BaTiS, since BaTiS does not have data on level 3 service categories, which means that while there is data on SJ3, there is no data on SJ31, SJ34 and SJ35. The Handbook provides a Mode 1 allocation of 80% to SJ3 for the period 2005-2019. I assume that it is 95% from 2000 onwards (last row of above table). Looking at the proportions allocated to SJ31, SJ34 and SJ35 (2020-24) this does not seem like an unreasonable assumption.
Another observation about BaTiS, is that since it only reports SJ3, it is reasonable to assume that it includes:
SJ32 – Waste treatment and de-pollution, agricultural and mining services
SJ33 = Operating leasing services
These categories are not part of DDS, so it would be fair to conclude that SJ3 in BaTiS is an overestimate of SJ3.
Finally, although BaTiS, is a ‘constructed’ bilateral trade in services database, it is the only one that provides a balanced panel from 2005 to 2024 for about 200 economies. All other databases, TiSMoS, DDS and the WTO services trade databases provide unbalanced panels as they have missing observations for many economies. Anything related to DDS is best treated as an estimate. There are no definitive numbers. More importantly, my major concern with the attributions to Mode 1 in the Handbook is that the same set of proportions apply to all countries regardless of level of economic development – so there is no ‘digital divide’. All the more reason for them to publicly issue a methodology update.

Leave a comment