There are many ways to measure exposure of a particular industry or economy to an industry in another economy. Value exposure is one way; another is to look at the frequency of value chain exposure to an industry in another economy. The OECD pass-through frequency (PTF) database provides information on the latter. I extract information from there, although to prevent data-overload I don’t report actual numbers, but I do provide an example and summary statistics in the notes below.
In step 1, I ask: Which _________ industry’s supply chain engages (or passes through) most frequently with the Saudi Arabian Mining and quarrying, energy producing products (crude petroleum and gas etc.) in producing its own product? In the blank we may fill in the name of the ASEAN economy of interest. In other words, I ask this question ten times (Timor Leste is not included), for each Saudi Arabian industry of interest. Note that the value chain does not have to start in Saudi Arabia even though crude oil and gas is an upstream sector, it can originate anywhere.
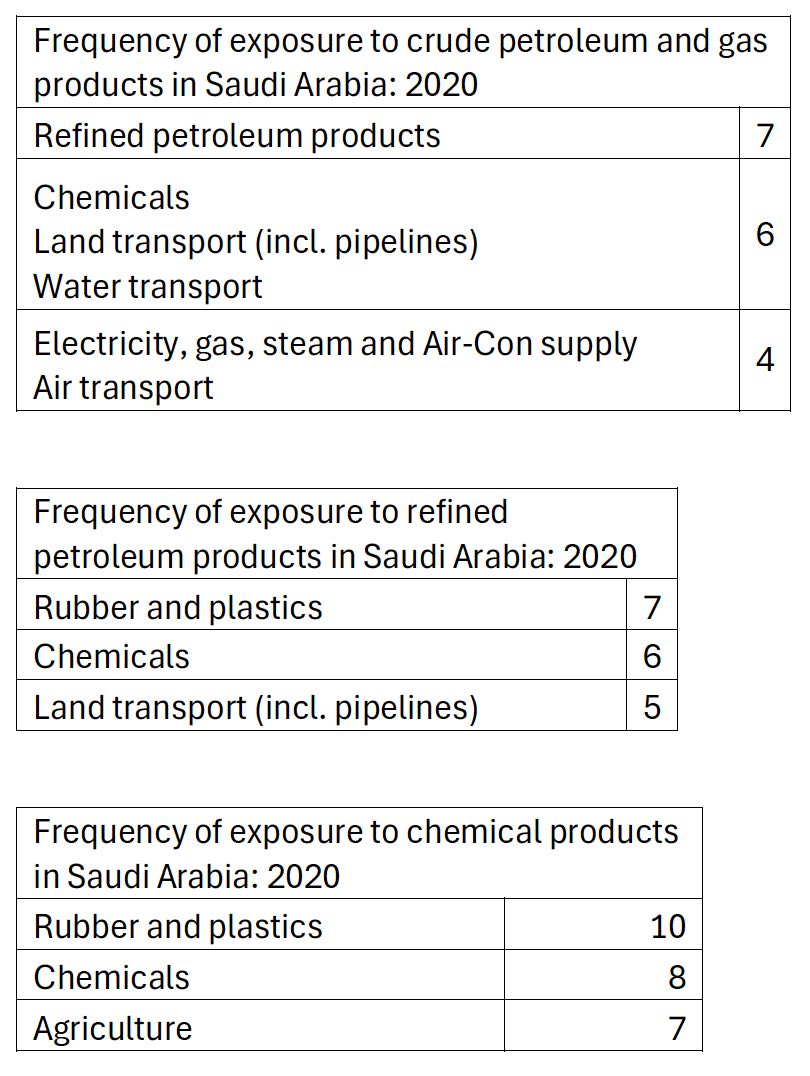
In step 2, I identify the top 5 most exposed sectors (or those which engage most frequently) for each ASEAN economy. And in step 3, I identify the most frequently (top 3) occurring sectors in the list of top 5. The frequency count as reported below is identical to the number of ASEAN economies in which the same industry is in the top 5 most frequently exposed. It is likely that these will be impacted first if they can no longer engage with the Saudi crude petroleum sector.
I repeat this exercise three times: for crude petroleum and gas products, refined petroleum products and for chemical products. Why only Saudi Arabia? because it is the only GCC country identified separately in the database. The others are all in ROW or rest of the world. The most recent year for which data are available is 2020.
Of course, due to the variation in the levels of economic development and the import dependence on GCC countries, the most exposed sectors differ across ASEAN economies. In Lao PDR for example, the most exposed sector to Saudi crude oil and gas is warehousing and support activities for transport, followed by water transport. Whereas in Singapore, the second most-exposed sector is air transport. In Malaysia, pharmaceuticals is the most exposed sector to Saudi refined petroleum products and chemical products and in Lao PDR, some of the most exposed sectors include textiles and paper products & printing.
The broader lesson however is that practically all sectors in all countries are ‘exposed’ since there are hardly any ‘zeros’ in the database. So, inventing new ‘code words’ as Western countries were busy doing after the covid pandemic: near-shoring, friend-shoring, trusted partners, secure-supply chains, de-risking, small yard high fence etc. are not easy to implement in practice and it is more difficult to identify their eventual impacts. As far as I know, there is no theory of optimal intervention in networks. Inter-country input output tables/ multi-regional input output tables, on which the PTF measure is based can be represented as one massive weighted, directed network. So maybe it’s also time for talking-heads, particularly of the geopolitical variety to stop using ‘de-globalization’.
Notes
The OECD pass-through frequency database uses an earlier version of the ICIO (inter-country input-output) tables, so 2020 is the latest year for which data are available.
Data can be extracted to answer a number of analytical questions. Examples are provided on the website. Here I ask the following question (Question 4 on the OECD website):
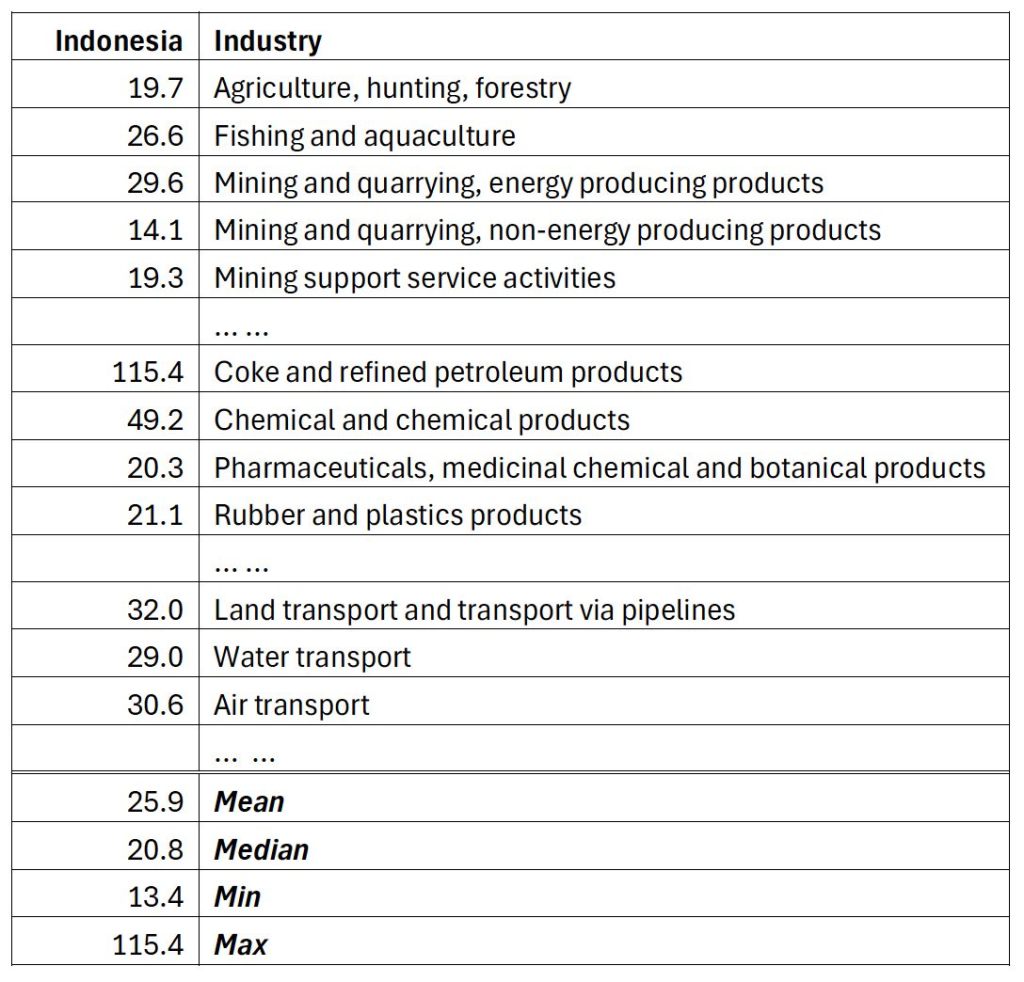
Which Indonesian industry’s supply chain engages most frequently with the Saudi Arabian Mining and quarrying, energy producing products industry (crude petroleum and gas etc.) in producing its own product?
Asking the question yields the following table (where I only report a subset of the 44 industries, or rows).
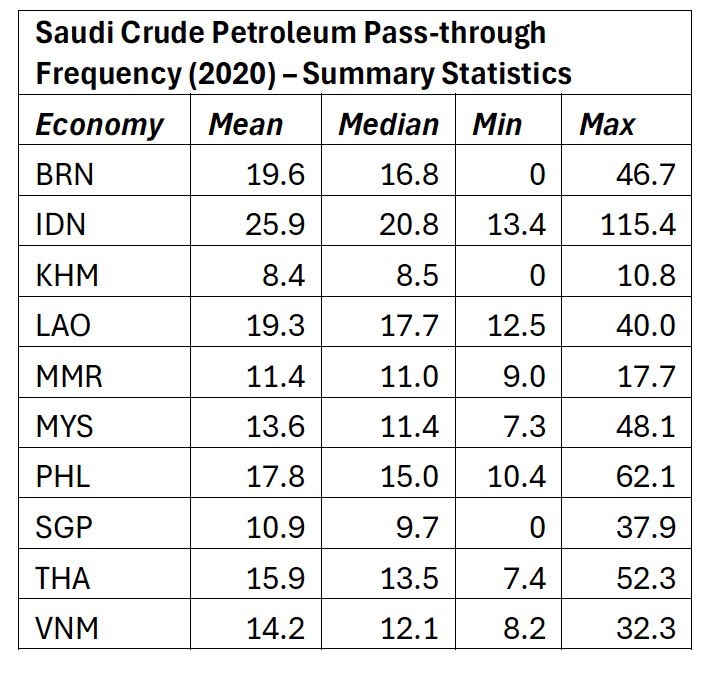
I report here the summary statistics for ten ASEAN economies.

Leave a comment