
Here are some visualisations on imports and exports of environmental (ENV) and low carbon technology goods (LCT) for ASEAN countries for 2023. To prevent clutter, the visualisations represent 80% of imports and exports.
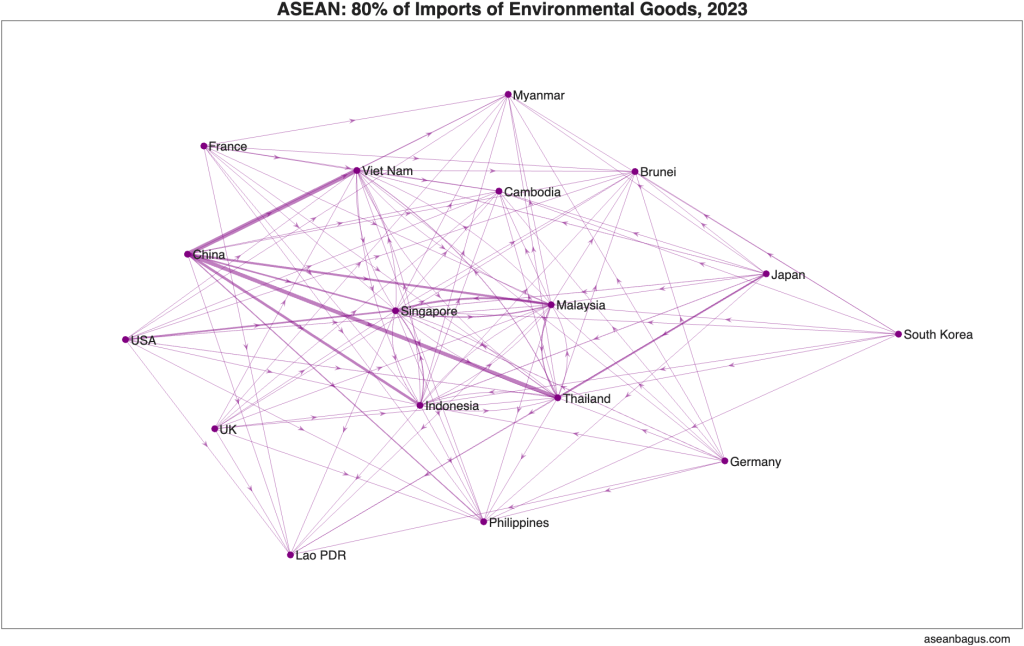
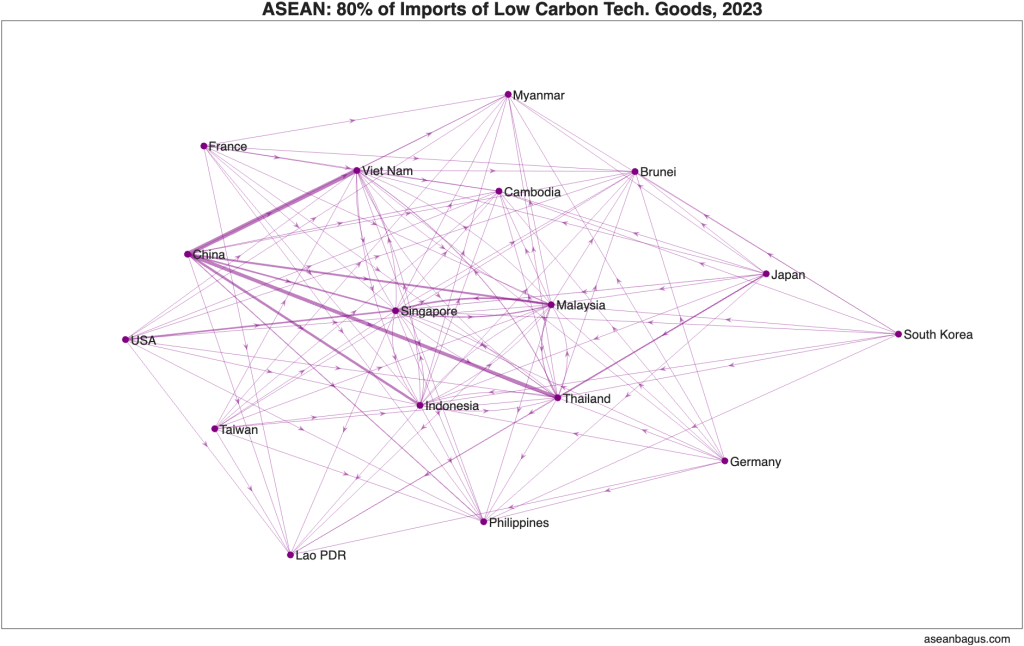
The visualisations for imports look very similar, except that the UK (in ENV imports) is replaced by Taiwan (in LCT imports). France, Germany and the US are the only western countries that appear in the visualisations for imports, and the edges (lines connecting the nodes) are thin, implying that the value of imports is relatively low. The import sources are primarily Asian. China is the major source of imports, and the major importers are Indonesia, Malaysia, Singapore, Thailand and Viet Nam. Singapore also imports from the US and Thailand from Japan.
The export visualisations show that there are more export destinations are more diverse than import sources. For example, export destinations include India and all three countries in north America. The US is the main destination for exports, and Malaysia, Thailand and Vietnam are the major exporters.
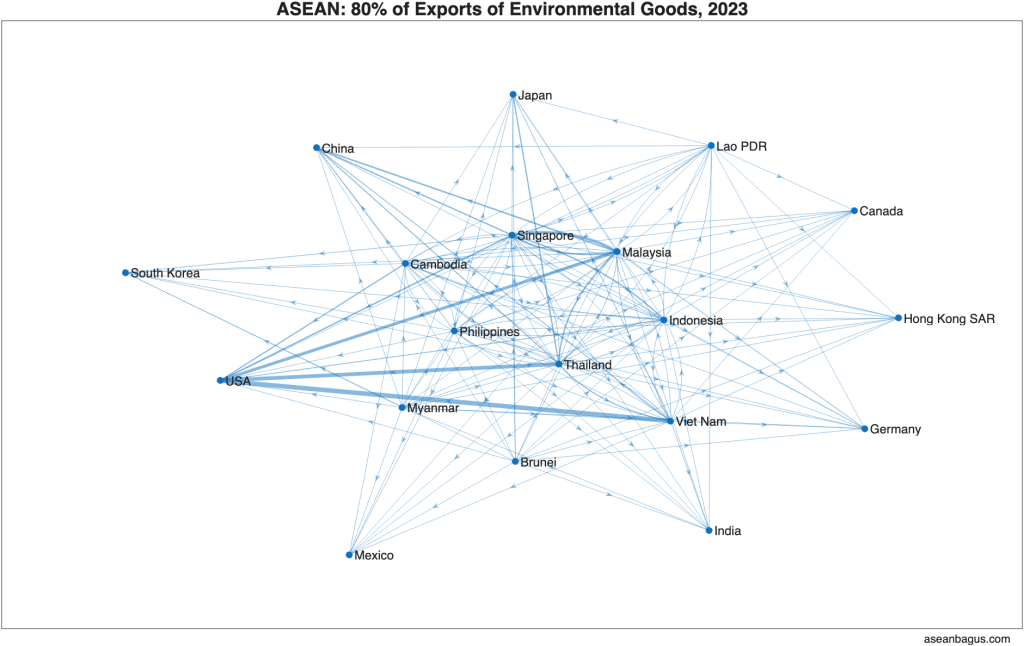
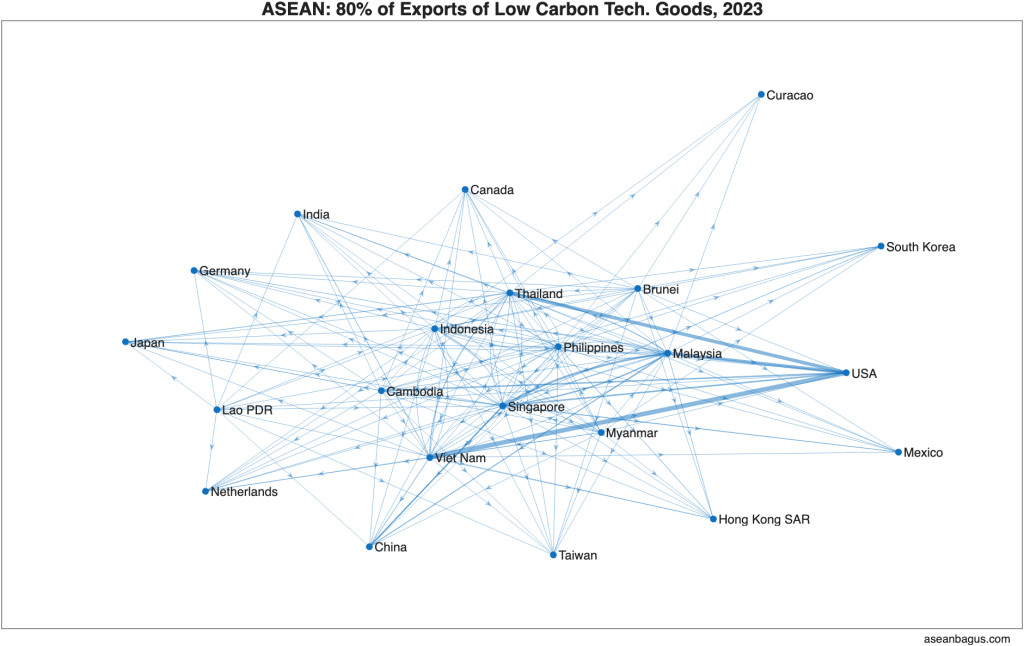
ASEAN is importing ‘green goods’ primarily from China and exporting to the US.
Sources
BACI balanced trade (HS 2017). Top import sources and export destinations representing 80% of (cumulative) imports and exports are identified for each ASEAN country. The countries in the visualisations represent the union of the partners.

Leave a reply to ASEAN Low-Carbon Technology Trade – asean bagus Cancel reply