
The previous post showed the observed export structure of ASEAN economies. Here I use Teza’s approach to show the ‘capability adjusted’ export structure of ASEAN economies. Teza uses data on all the exports of a country to construct a Shannon entropy measure (Hc). This is a measure of diversity. If few exports dominate the export basket, then Hc is lower. A higher Hc represents more balanced capabilities and more diversity. This ‘raw’ measure makes no judgement about products. In order to adjust for ubiquity Teza applies a fixed-point iteration to the ‘raw’ Hc where country diversification and product ubiquity reinforce each other. Products are ‘re-weighted’ in every step where exporting common (ubiquitous) products contributes less, and exporting ‘statistically rare’ products contributes more. Or, product sophistication is defined by the entropy of exporters, so the weights are adjusted to reflect capabilities.
The following figure shows the capability-adjusted export structure of over 200 countries in 2023. ASEAN and selected Asian countries are labelled as are some others for comparative purposes. The horizontal axis measures optimized entropy (Hc). The vertical axis shows total exports in billions USD (log scale) and the colours represent the number of (6-digit) products exported by a country in 2023.[Please open all images in new tabs].
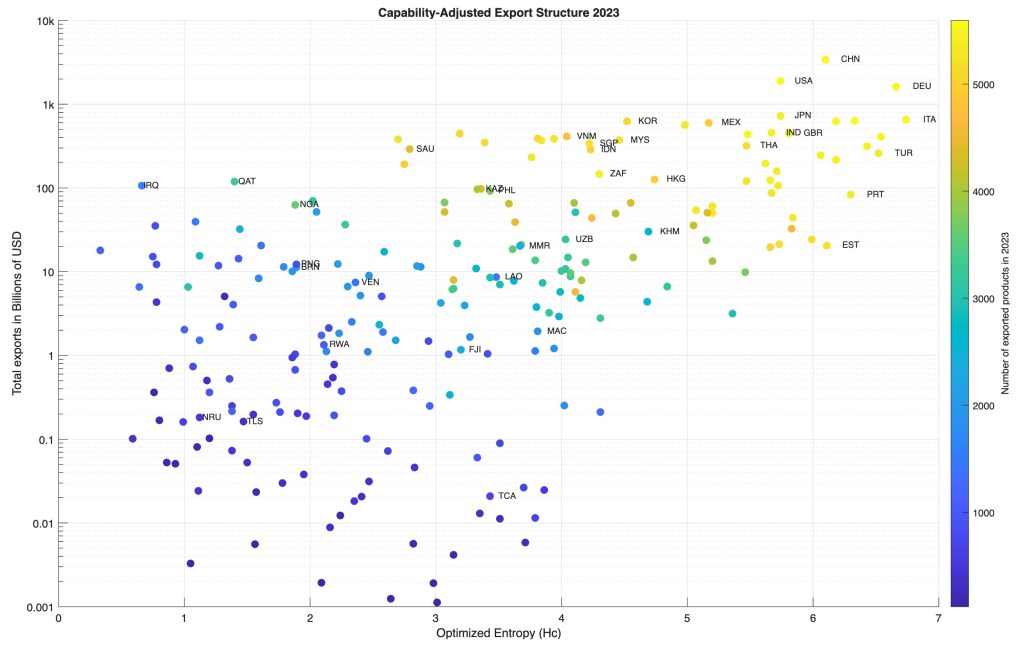
More sophisticated exporters, and particularly those that export an overwhelming majority of the over 5000 products are the top-right of the chart. Germany has a higher entropy than both China and the United States. The least sophisticated economies and those that export fewer than a thousand products lie closer to the origin (bottom-left). These are the dark blue dots (Timor-Leste). The oil and gas exporters are bunched together (Iraq, Qatar, Nigeria); they have high exports but low entropy. Brunei and Lao PDR have roughly the same level exports, but Brunei has lower entropy since it relies on oil and gas exports. Amongst the larger ASEAN economies, Thailand has the highest entropy (electronics, auto industry etc.). Amongst the smaller economies, Cambodia has the highest entropy. Although it does not export a large number of products relative to the larger ASEAN economies, this may reflect certain niches in its garment, footwear and travel luggage/goods sectors.
The next figure shows changes in the export structure of ASEAN and a few other economies between 1996 and 2023. The axes are the same as in the previous figure.
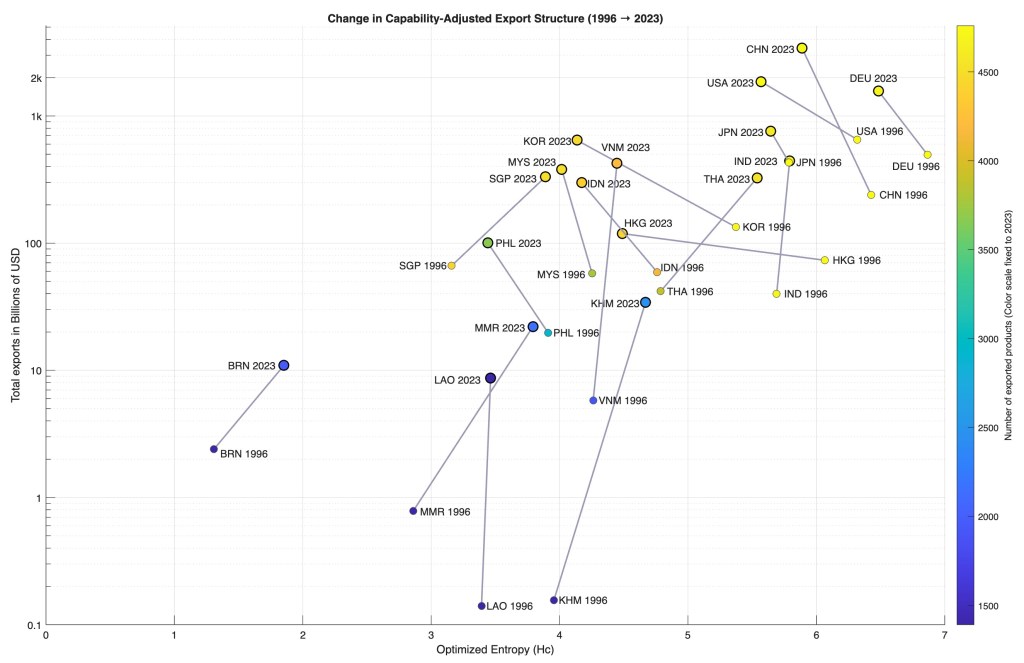
Lao and Vietnam show primarily upward movement indicating large increases in the value of exports, but marginal changes in entropy. Brunei, Cambodia, Myanmar, Singapore and Thailand have moved up and to the right. Their export structures have become more sophisticated, or they have upgraded their capabilities, along with increasing exports. Indonesia, Malaysia and Philippines have moved to the left, towards more concentration or more specialization. This is not necessarily a ‘bad’ thing, China, Germany and the United States have also moved to the left. But they already export almost all of the over 5000 (6-digit) products. When you export pretty much everything then there is little room to diversify. Their move to the left reflects more concentration and deep specialization. In the case of the Philippines which exported roughly 3000-3500 products in 2023, losing breadth or becoming narrowly dependent on a few sectors reflects stalled upgrading or ‘stuck’ capabilities.
The 6-digit entropy index can be decomposed into an inter-sectoral component (diversification across 4-digit product categories) and an intra-sectoral component (diversification within 4-digit categories at 6-digit granularity). Using these we can think of the process of diversification as a two-step process. In the first step developing and emerging economies diversify across major exports sectors (4-digit) and then once broad sectoral coverage has been achieved, the focus shifts to deepening specialization (within 4-digit industries or sectors). Of course, countries can do both at the same time, but eventually, as countries (like Germany, China and the United States) export almost all (6-digit products) they must focus on deepening specialization within (4-digit) sectors. The next figure shows intra-sectoral entropy for ASEAN and other economies, relative to total exports in billions of USD (log scale).
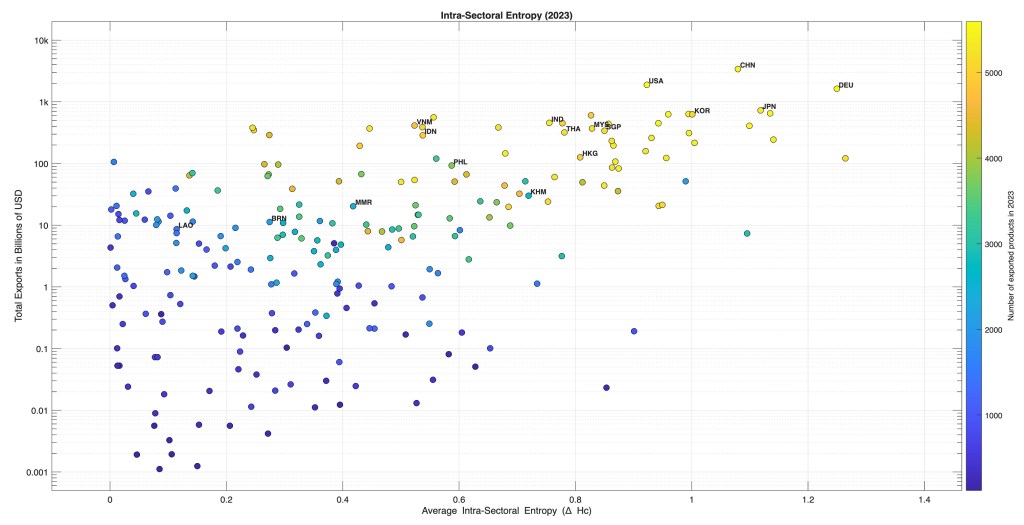
On this measure, we see that both Germany and Japan are ahead of China and Singapore is ahead of all other ASEAN economies.
Notes
The figure (capability adjusted export structure 2023) is similar to figure 4(a) in Teza.
The figure (Intra-Sectoral Entropy 2023) is similar to Figure 6(b) in Teza.
Sources
Trade data are from the BACII balanced trade database.
2023 figure uses HS 2022 (6 digit)
1996-2023 figure uses HS 1996 (6 digit)
Teza, G., Caraglio, M. & Stella, A.L., Entropic measure unveils country competitiveness and product specialization in the World trade web. Sci Rep 11, 10189 (2021).

Leave a comment