It’s a Singapore Story
As I wrote in an earlier post, there is no single accepted definition of ‘green goods’ (and therefore green trade). For digital trade, there now appears to be a definition in the IMF-OECD-WTO-UNCTAD Handbook on digital trade, but data are hard to come by even for OECD countries. Since there is more than one mode of cross-border supply recognised under GATS, all existing data should be treated as estimates, as the attribution to modes for a given service category does not vary across countries and is somewhat arbitrary (see Methodology).
Digital trade is a subset of international trade in goods and services. The Handbook defines it as trade that is digitally ordered (but through a specific platform designed for the “purpose of receiving or placing orders”) or digitally delivered. The former is ‘more goods’ (e-commerce) and the latter is ‘more services’ (or digital goods, like music). Note that ordering by email is not included but receiving by email is, since email is not designed specifically for the purpose of ‘placing orders’. There are no estimates for digital trade as a whole (although the OECD has some experimental data), but digitally deliverable services can be estimated. The WTO has recently started publishing data on digitally delivered services, which is used here. The difference between “digitally deliverable” (as the Handbook describes it) and “digitally delivered” (as the WTO refers to its database) is not critical as regardless of what one calls it, it is an estimate, so I refer to it as DDS. The DDS data only provide estimates of total exports and imports for any given economy; in other words, the partner is the world – bilateral DDS trade data are not available as yet.
The data in the following tables speaks for itself, and it is clear that this is more of a Singapore story than an ASEAN story as Singapore is the dominant participant in DDS trade and will remain so for the foreseeable future.
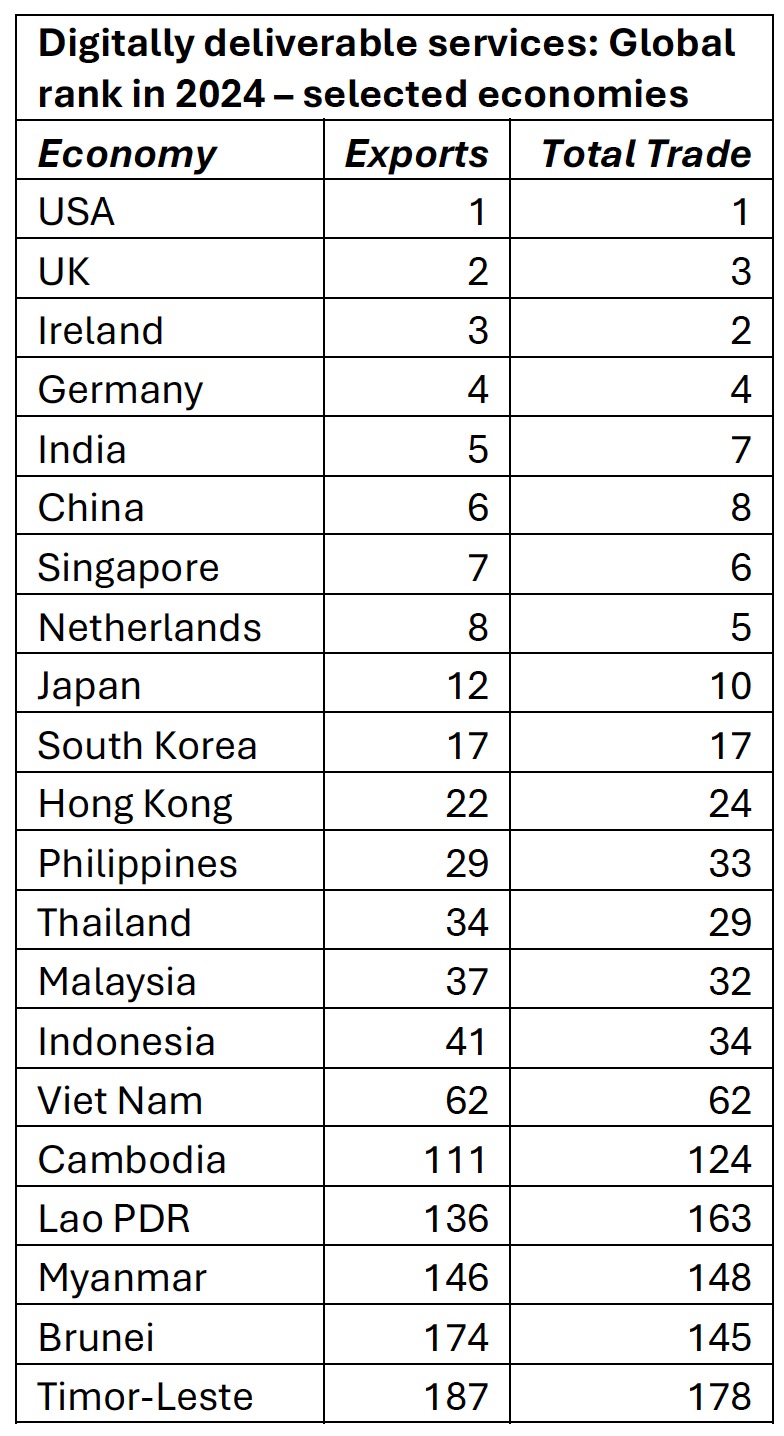
In 2024, Singapore was in the top 10 in world rankings of exports of DDS and total trade in DDS. Philippines, Thailand and Malaysia were ranked between 29 and 37. Vietnam was ranked 62 and the remaining smaller ASEAN economies were in the bottom 50% of the 200 economies in the DDS database.
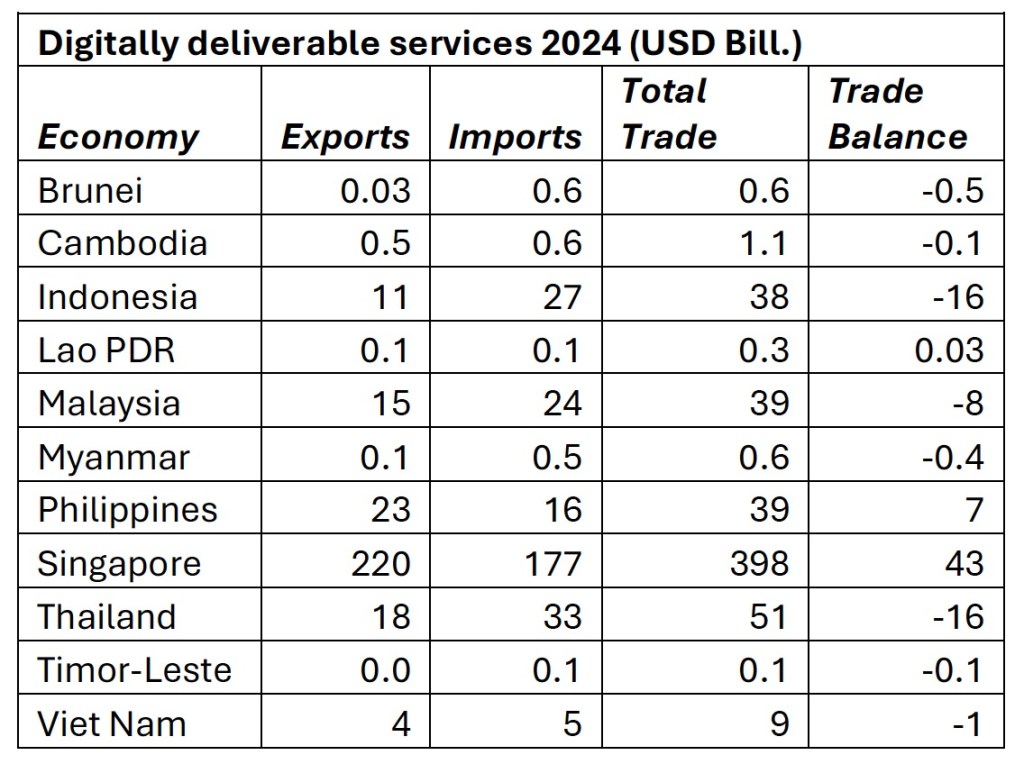
In 2024, Singapore accounted for 75% of ASEAN’s DDS exports, 62% of DDS imports and 69% of ASEAN’s total trade in DDS. The Philippines, which was the number two exporter (23 bill. USD), exported roughly 10 times less than Singapore (220 Bill USD). Similarly, Singapore’s total trade in DDS was roughly 10 times more than that of Indonesia, of the Philippines and of Malaysia. Most ASEAN countries were net importers of DDS in 2024, Singapore, the Philippines and Lao had a positive trade balance.
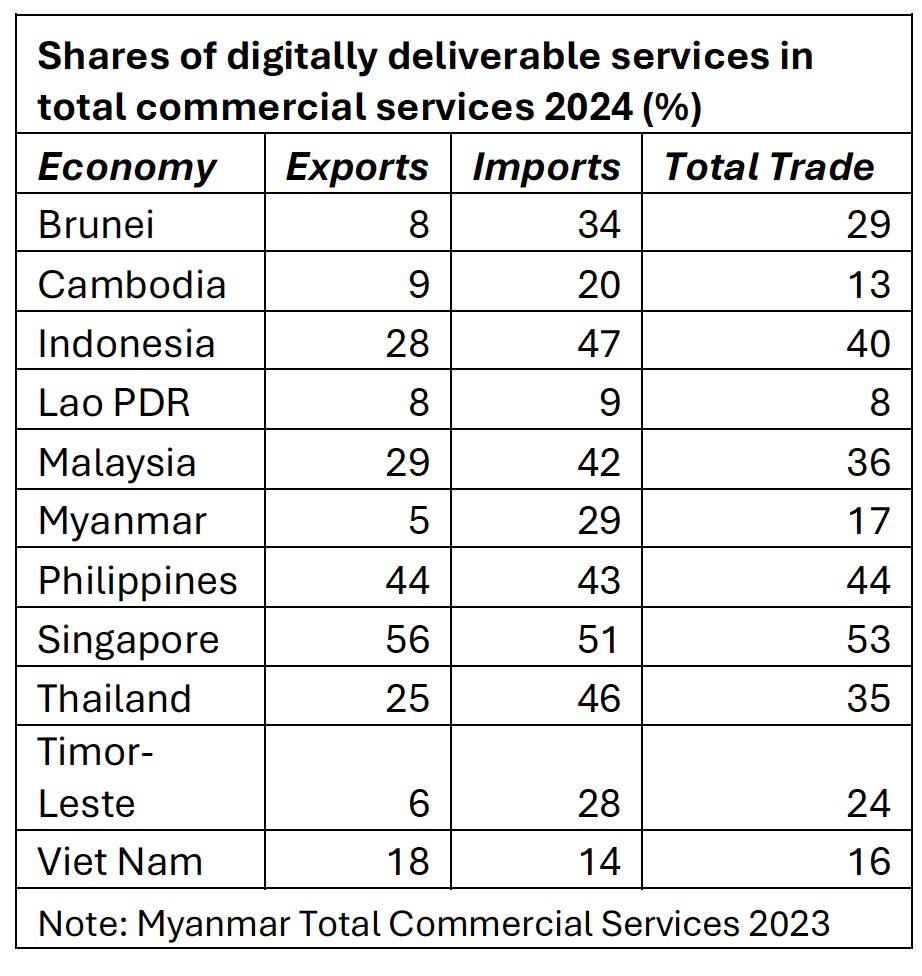
More than half of Singapore’s commercial service exports, imports and total trade were accounted for by DDS in 2024. For the Philippines, the shares were between 43 and 44 percent.
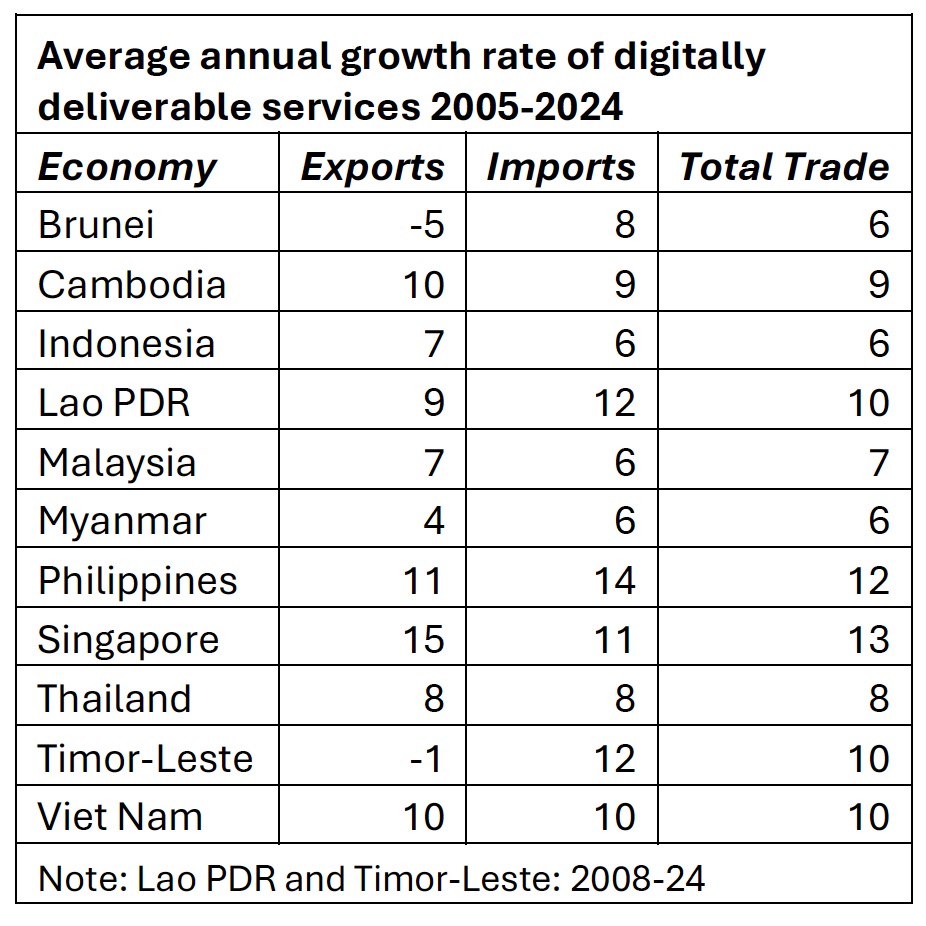
Singapore not only dominated in value (or level) terms but the annual growth in Singapore’s DDS trade over roughly the past two decades was amongst the highest in ASEAN. Like Singapore, DDS trade of the Philippines also grew annually by between 11 to 15%.
Sources
WTO: Trade in services by mode of supply dataset (TiSMoS).
WTO: Digitally delivered services dataset (DDS).
IMF-OECD-UNCTAD-WTO Handbook on Measuring Digital Trade, second edition, 2023.
The General Agreement on Trade in Services (GATS).
Methodology
GATS recognises four modes of supply of services. Mode 1 is cross-border supply or service flows from one economy to another (for example, financial services provided online across borders). Mode 2 is consumption abroad (for example tourism, you go from Singapore to Siem Reap to consume/purchase heritage/cultural services – see Angkor Wat). Mode 3 is through commercial presence (for example MNCs; DBS bank provides banking services in Malaysia by establishing an ‘affiliate’ and a branch network in Malaysia.) Mode 4 is via movement or presence of natural persons (for example, a Singaporean doctor goes to Dili to provide medical services).
Presently DDS data include only Mode1 trade. Mode 2 is most relevant to travel, and travel is not presently included in DDS; neither is Mode 3 (for example data storage/cloud services could be provided either via mode 1 or mode 3). Estimating mode 3 requires data on foreign affiliates (of domestic firms) which is not readily available, particularly for ASEAN. Allocation to modes is somewhat arbitrary and for any service category, it is the same of all countries. For example, 100% of finance and insurance is allocated to Mode 1 whereas 75% of professional and consulting services are allocated to Mode 1. It is evident from TiSMoS that these allocations have changed (increased) from 2020 onwards, even though the changes have not been disclosed by the WTO in any ‘methodology update’ document.
The tables in this post are derived from the data in the DDS database, so there is little to say about methodology. A description is available in the Handbook. However, before the WTO released DDS, the only way to estimate digitally deliverable services was to use TiSMoS. It could now be considered obsolete since it provides data up to 2022 whereas DDS is updated annually and the most recent version provides data up to 2024.
Since I had used TiSMoS earlier I decided to compare my estimate of DDS for ASEAN countries from TiSMoS with that of the DDS data as published by the WTO. For a majority of the observations (for all ASEAN economies), the data were identical, except for some minor discrepancies in a few years for a couple of economies. But there were two more important issues.
Firstly, Lao PDR had negative imports in the DDS database for three years 2005-2007, whereas my TiSMoS estimates were positive. How can imports be negative? I wrote to the WTO and they wrote back to say: “Under the BPM5 methodology, the measurement of insurance and pension services can result in negative values. Therefore, the total value of digitally delivered services may also be negative.” Hopefully version 6 of the Balance of Payments Methodology will resolve this problem, otherwise the negative values can be replaced by estimates from TiSMoS.
Secondly, there was a more serious problem with the exports of the Philippines, the DDS data and TiSMoS estimates are shown below (30% is a lot). The imports were identical from both sources. So, using DDS (as opposed TiSMoS), implies exports and total trade are lower and the trade balance is worse.
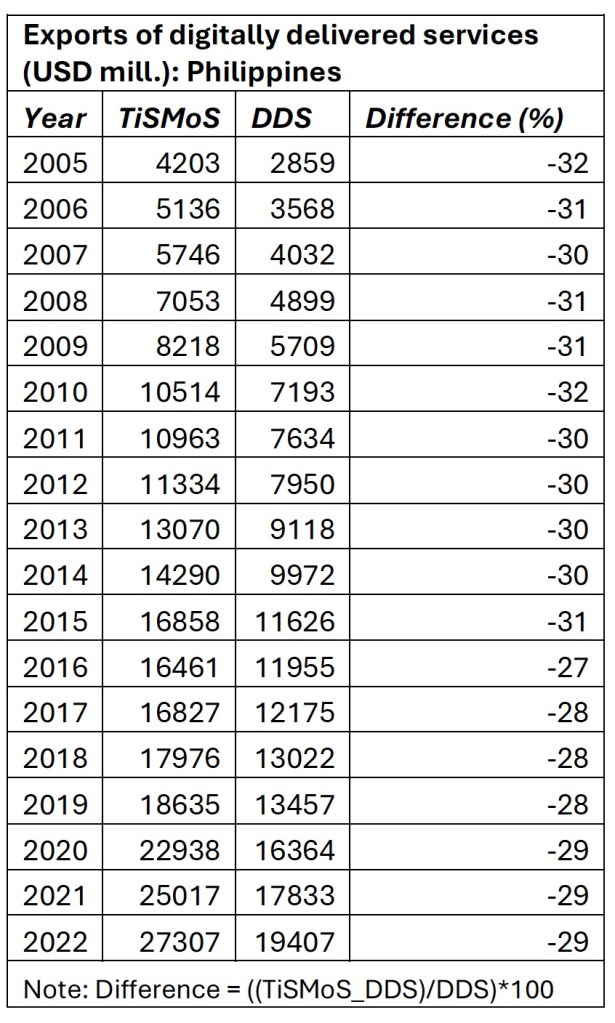
The WTO did not specifically address my question regarding the Philippines but said: “Please also note that data on digitally delivered services and TiSMoS should not be compared, as they were produced in different years and revisions to official statistics may have occurred.” Well, they can be compared and are identical not just for imports of the Philippines, but exports and imports of all other ASEAN economies (with a few minor exceptions for a couple or countries for a few years). Obviously, some changes have been made to the methodology. In fact, changes (increases – the WTO’s COVID bump?) have also been made to the allocations to Mode 1 from 2020 onwards – making Annex D of the methodology Handbook out of date, and only applicable to the period 2005-2019 – this is clear from using TiSMoS to derive estimates, but any changes have not been made public by the WTO. There is no way to resolve this issue – no third source is available to try and triangulate the exports of the Philippines or to understand what is really going on under the hood in the DDS database. User beware!

Leave a comment