Economies in Asia are very dependent on oil and gas from West Asia (middle-east) and since Asia is also the manufacturing and export engine of the world, very soon the price impacts are going to show up in other parts of the world including in the Rogue Nation.
The shock is not just global but also uneven. It’s impact is difficult to measure, yet I provide estimates of the value chain exposure of ASEAN to three sectors in GCC economies. I use the latest available version of the OECD inter-country input-output tables (ICIO for the year 2022) to calculate value chain exposure of ASEAN economies to three sectors/industries in GCC economies: crude oil and gas, refined petroleum products and chemical products.
In the following table, FD exposure refers to the (direct and indirect) exposure of ASEAN final demand to GCC value added (in the three sectors). The FD exposure ratio for Brunei for example shows that 6.1 cents of every dollar of Brunei’s final demand can be traced back to value added (or income: wages + profits) generated by GCC economies in the three sectors (crude oil & gas, refined petroleum and chemicals). In dollar terms (multiplying by total final demand of Brunei) this amounts to USD 0.8 billion. In all ASEAN economies, most (85-90%) of this comes from exposure to the crude oil and gas sector in GCC economies. (See notes for a sensitivity exercise using the ADB’s multi-regional input-output tables.)
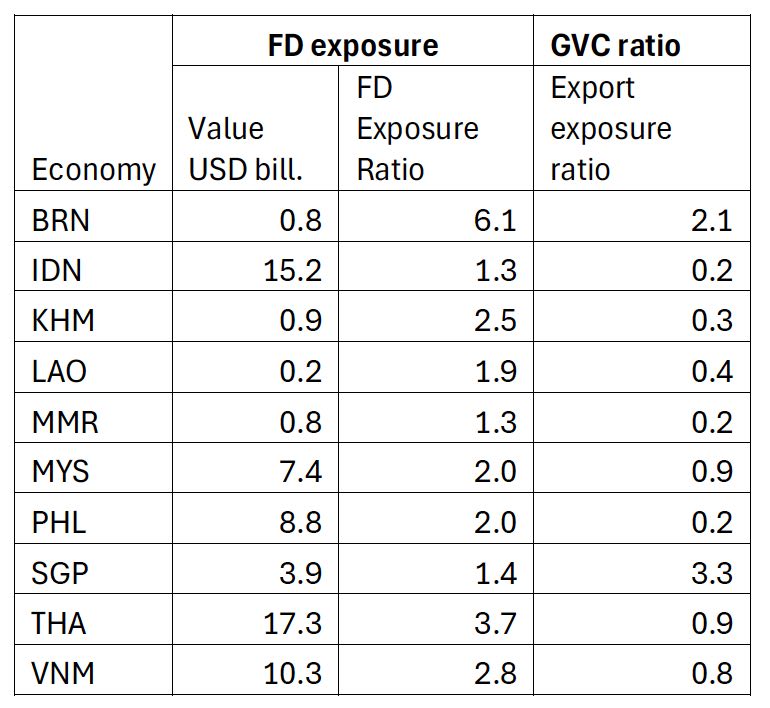
ASEAN economies are export-oriented, so the ‘exposure’ to GCC is ‘passed through’ to other economies via two channels: exports of intermediate goods and exports of final goods. The GVC ratio (export exposure ratio) shows this pass-through. It is the ratio of exposed exports to exposed final demand. Exposed Singaporean final demand is USD 3.9 billion, so exposed exports are 3.3 as much or roughly USD 13 billion.
These measures can be calculated at the industry or sector level as well. I calculate the final demand exposure by industry to identify the top-5 or the five most exposed industries in each ASEAN economy. What is reported below is how frequently an industry appears in the top five. Air transport appears in the five most exposed sectors in every ASEAN economy (Timor-Leste is not included in the ICIO tables). Similarly, food and beverages appears only once. It is the fifth most exposed sector in Cambodia.
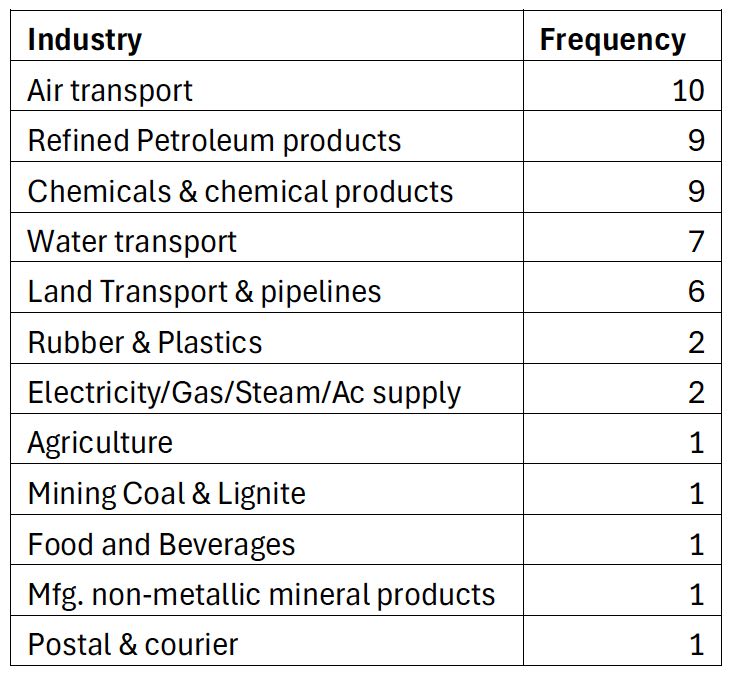
In terms of magnitude, the exposure of Thai industries is the highest. The most exposed industry is electricity, gas, steam & air-conditioning supply where 25 cents of every dollar of final demand (for this industry) can be traced back to the three sectors in GCC economies. This is followed by and refined petroleum products (0.23), chemicals & chemical products (0.12), manufacturing of non-metallic mineral products (0.11), and finally air transport (0.10).
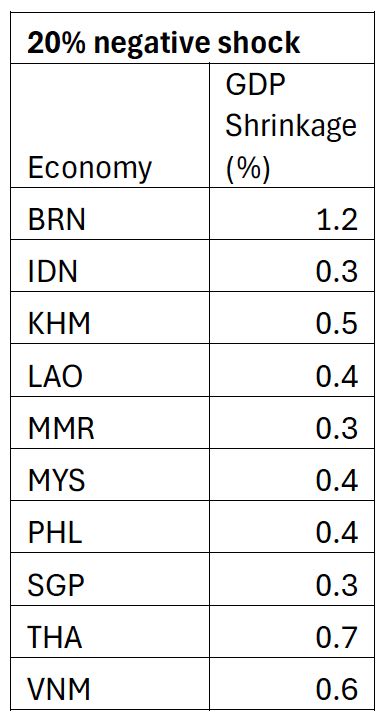
Lastly, I estimate the GDP contraction (or shrinkage) in ASEAN economies due to a 20% reduction in the value of inputs supplied by the GCC’s crude oil & gas, refined petroleum products and chemicals industries. The results are provided below.
In a previous post I suggested that ASEAN should use Chinese technology to pursue clean energy with a vengeance. It would appear that the head of the World Energy Council agrees with this view. She warns that the “energy transition could be delayed by decades if countries choose to build their own supply chains rather than utilizing China’s existing production capacity”. Further, she states “I think we should stop using the word ‘overcapacity.’ It’s a disservice to what the world needs and what China is doing”.
Meanwhile the EU is busy playing word games: “do more say less” is the latest. What are they doing? Stopping EU funding for clean energy technology projects which use Chinese inverters. Inverters are used in solar and wind systems. The ‘brilliant’ British have blocked the use of wind turbines produced by Ming Yang Smart Energy Group Ltd. due to “national security concerns”.
But neither the European nor the British elites can be blamed, their many phobias (Russophobia, Sinophobia, Islamophobia and more recently Daddyphobia) prevent them from working the good of their people, or from getting the ‘guns vs. butter’ decision right. Given enough time, every problem becomes structural.
Notes
I use the most recent ICIO tables (small version) from the OECD, which are for the year 2022. The tables have 80 individual economies and ROW (the rest of the world) and 50 sectors or industries. Only two GCC economies, Saudi Arabia and the UAE appear in the 80 economies. I include ROW to represent the others – Bahrain, Oman, Kuwait and Qatar and other smaller suppliers. With the exception of Qatar, ROW does not include a majority of the other important (non-GCC) suppliers to ASEAN, since these are included as individual economies (among the 80). Examples include Australia, Angola, DRC, Egypt, Kazakhstan, Morocco, Nigeria, Russia, South Africa and Tunisia.
For Saudi Arabia, UAE and ROW, the sectors (or suppliers) of interest include:
- Extraction of crude petroleum and natural gas (Crude oil & gas)
- Manufacture of coke and petroleum products (Refined petroleum products)
- Manufacture of chemicals and chemical products (Chemicals & chemical products)
The ADB also has publicly available MRIO (multi-regional input output) tables for the year 2024. I use these only to show that the differences in final demand exposed to the GCC can be quite substantial. The OECD tables use a top-down or macro consistency approach where are the ADB tables used a bottom-up approach (starting from individual country supply-use tables). There are other differences as well. The ADB reports exports and imports on a fob and cif basis respectively. Although the ADB tables are likely more representative of ASEAN and more recent (2024), they have fewer sectors/industries and they are missing Myanmar.
The ADB tables have 75 economies (including ROW) and three individual GCC economies: Saudi Arabia, the UAE and Kuwait. As before, other GCC economies are assumed to be in ROW, but this time, along with large African suppliers such as Nigeria and Angola since the ADB tables do not have any African, Caribbean or Central and South American economies. These are all in ROW.
The ADB tables have 35 sectors. For Saudi Arabia, UAE and ROW, the sectors (or suppliers) of interest include:
- Mining and Quarrying (Crude oil & gas)
- Coke, refined petroleum, and nuclear fuel (Refined petroleum products)
- Chemicals & chemical products
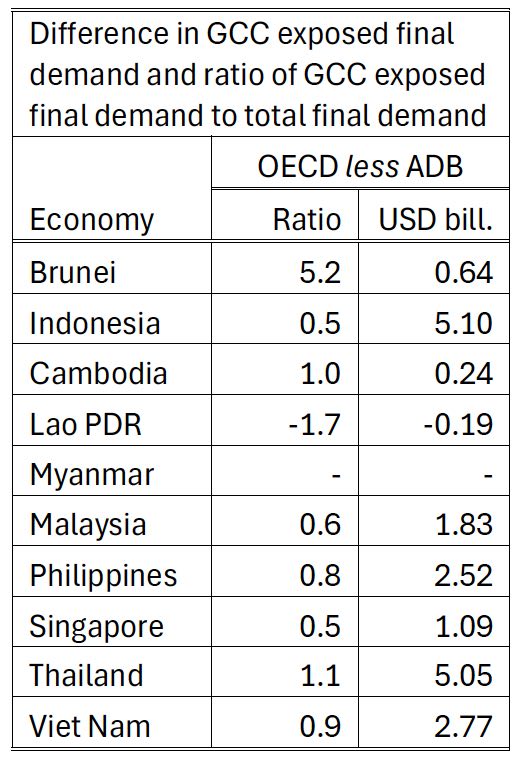
I do a sensitivity exercise just for final demand exposure of ASEAN to GCC economies. The results are shown below and the differences are substantial in many instances. With the exception of Lao PDR, using the ADB tables results in a smaller exposure, and particularly for Brunei. Clearly, results from input-output tables should be treated as ‘estimates’. And in this case the results from the ABD tables can be treated as a lower bound and the those from the OECD as an upper bound.
Sources
OECD (2025): ICIO
ADB (2025): MRIO
Caixin Global: “World Energy Council Head Urges Nations to Use China Tech to Go Green”, April 14, 2026.
Caixin Global: “China Slams UK Decision to Block Ming Yang Wind Turbines”, April 14, 2026.
South China Morning Post: “EU to cut funding for Chinese inverters as quiet offensive replaces grandstanding”, April 14, 2026.

Leave a comment