Structural trends in prosperity: Philippines vs. Vietnam
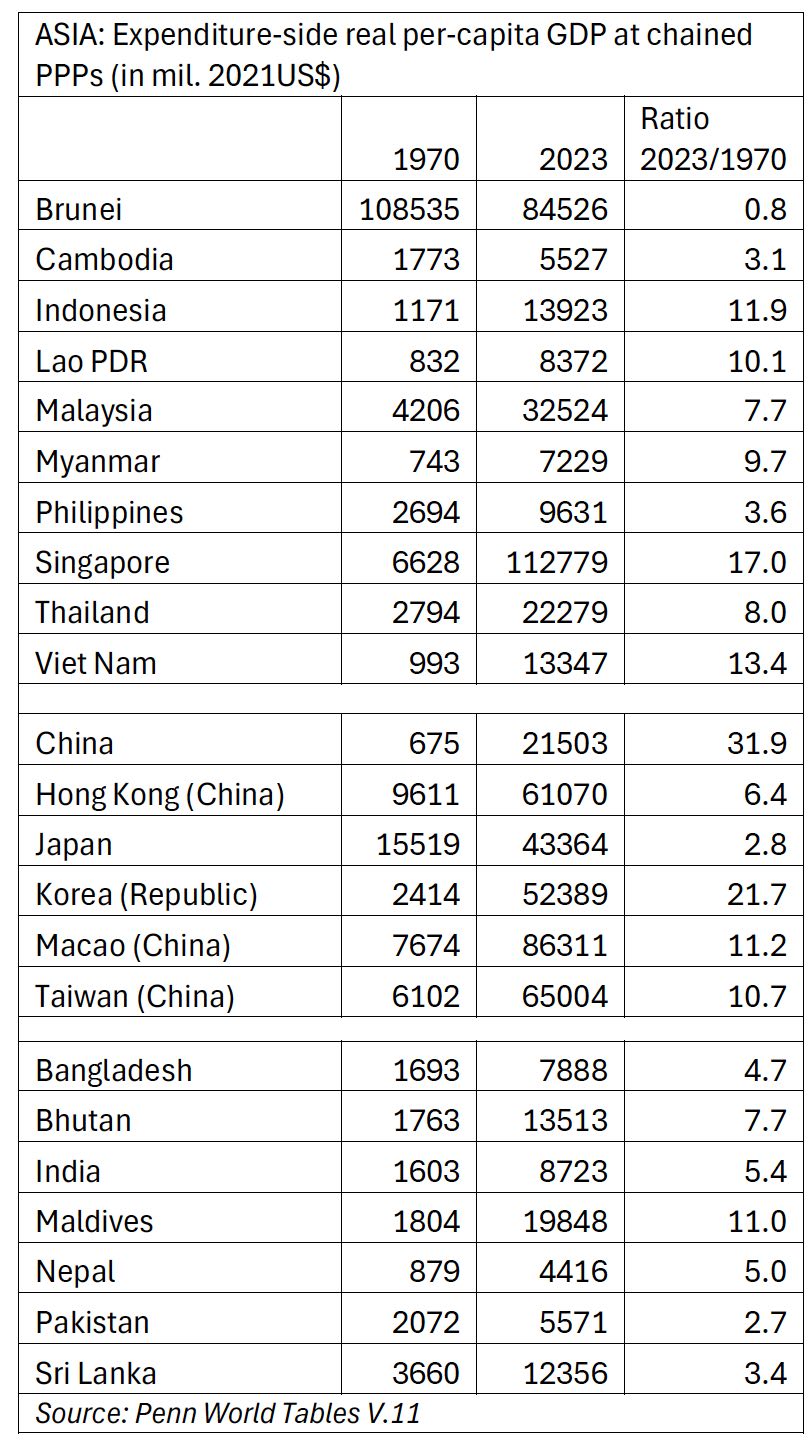
The Philippines is not just the slow man of ASEAN; it is the slow man of Asia. The following table shows that all ASEAN economies with the exception of Brunei (which is natural resource-based) and Cambodia; all North-east Asian economies with the exception Japan (which is a mature economy); and all South Asian economies with the exception of Sri Lanka and Pakistan, have, since 1970, done a better job than the Philippines in improving prosperity, or raising the standard of living of their people.
Media reports indicate that while tourists have returned to South-east Asia after the decline due to the Covid-19 pandemic, in 2025, visitor arrivals in the Philippines were 37% below pre-pandemic levels. It has not been successful in attracting tourists from other ASEAN countries as well. Apparently, the problems are structural; congested airports, poor transport infrastructure, poor connectivity between islands and a poor business environment. Michael Porter is of the view that every country can build a successful tourism cluster.
Economies may face identical external shocks (the present oil crisis, the Asian financial crisis, or the Covid-19 pandemic) or particular domestic economic or political shocks. This creates a lot of turbulence at the surface, or in the rate of growth of GDP, but this ‘top-line’ turbulence does not always fall to the ‘bottom line’, the underlying trend in prosperity, or the standard of living (real per-capita GDP). I use a Bayesian estimator (BEAST – see references) to examine the trend of the standard of living in the Philippines from 1950-2023. The results are shown in the following figure.
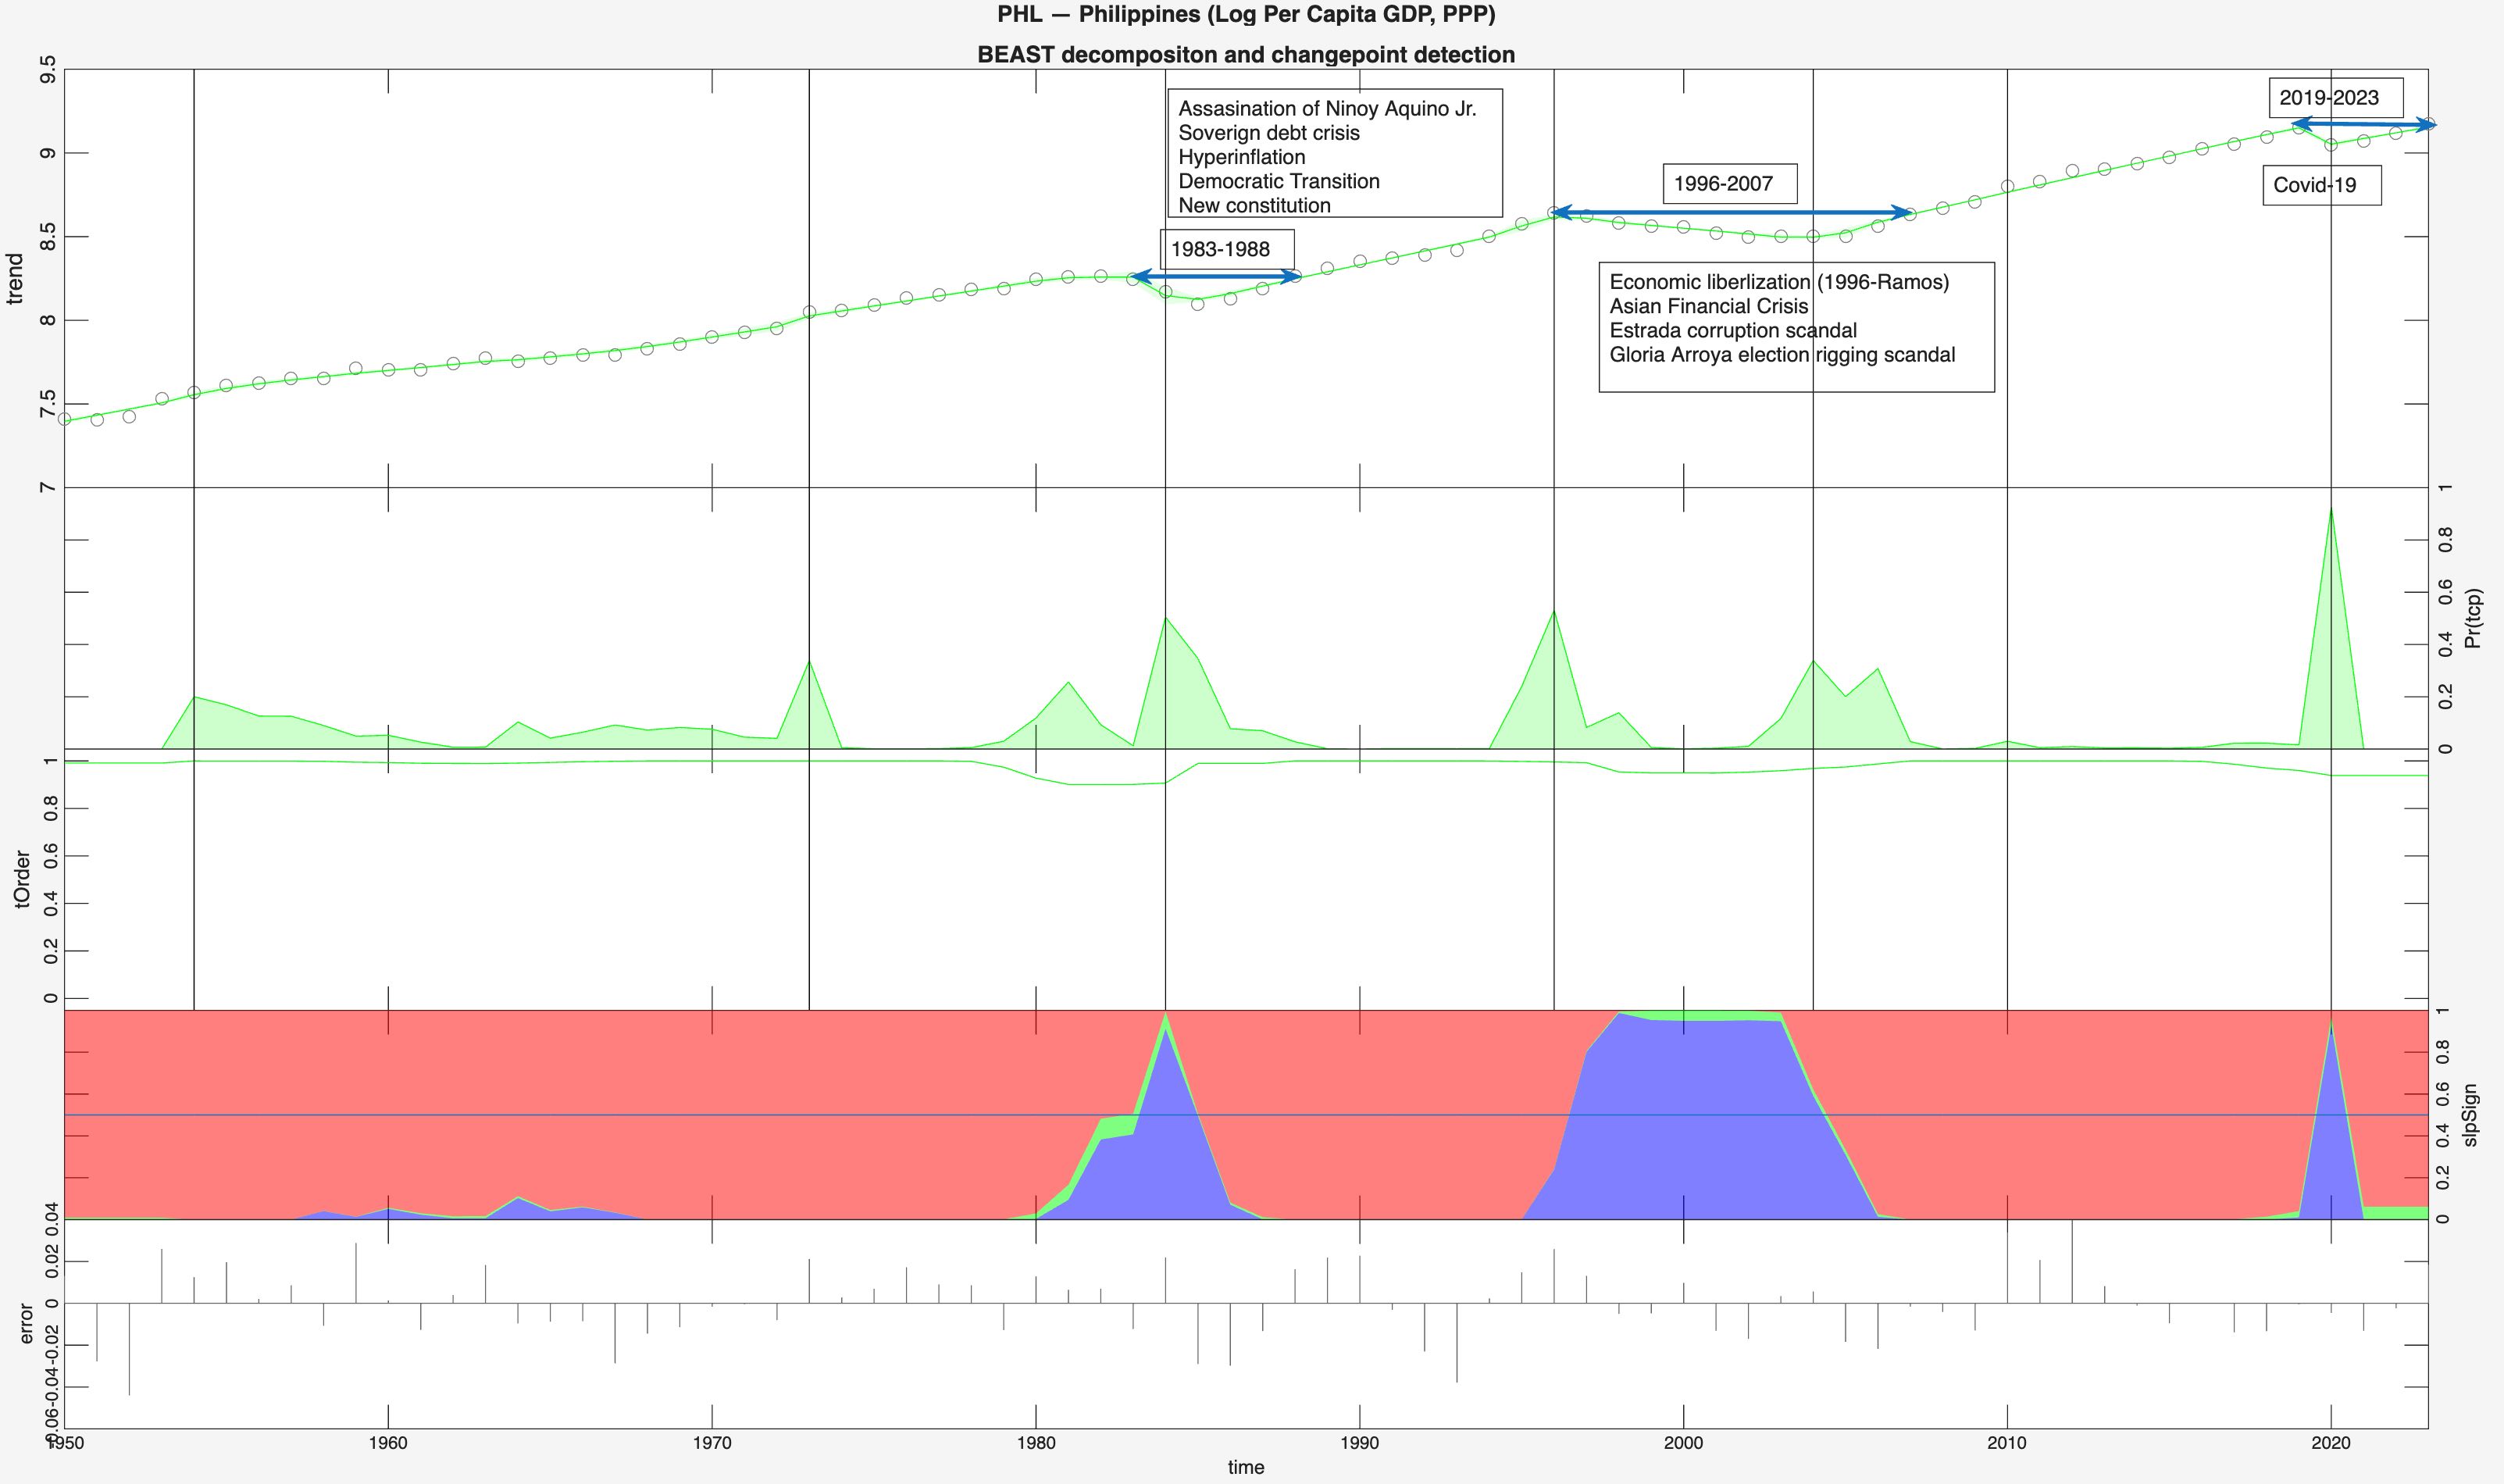
Only the first, second and fourth panels are relevant for the present purposes. The first panel shows the trend in the log of per-capita GDP (PPP). The second panel (with green hills/spikes) shows changepoints in the trend. The vertical axis of this panel measure probability, so not all changepoints are equal, some have higher probability. For the Philippines, there is a 43% probability of seven changepoints in the trend, but only four of them have a probability which exceeds 0.95. These are in the years 1984, 1996, 2004 and 2020. This panel only identifies potential changepoints in the trend and their associated probabilities, it says nothing about the direction of change.
To find the direction of change we have to look at the fourth panel (red and blue). In the fourth panel, the vertical axis measures the probability of the slope of the trend. Red indicates that the probability of the slope of the trend is positive (rising standard of living); blue indicates that it is negative (falling standard of living) and green indicates a zero slope (stagnant standard of living). In 1984 the trend turned negative; in 1996 it turned negative; in 2004 it turned positive, and 2020 of course is the covid down-turn and recovery.
Going back to the top panel, it can be seen that the Philippines roughly lost two decades between 1950 and 2023. The top-line turbulence showed up in the bottom line. It took roughly 5 years for it to recover from the 1983 downturn. Many economic and political events occurred during that period as indicated in the figure: the assassination of ‘Ninoy’ Aquino Jr., the end of the rule of Marcos Sr. and a transition to a more democratic system. On the economic front, there was a sovereign debt crisis and hyperinflation. These events set back the average person by five years.
The next downturn lasted for eleven years, from 1996 to 2007. This was also a time of political turbulence President Estrada followed ‘populist’ economic policies and was impeached due to a corruption scandal. The next President, Gloria Macapagal Arroyo was plagued by an election rigging scandal. On the economic front, in 1996, President Fidel Ramos had started an economic liberalization program but the financial crisis hit all ASEAN economies in 1997. The last downturn due to the Covid pandemic lasted roughly four years (2019 – 2023).
There is a changepoint detected in 1973, but the probability is 50% and, in any case, prior to 1983 the trend in per-capita GDP is red (or positive). The dictatorship of Marcos Sr. lasted from 1972 to 1981(official end) and he was ultimately ousted in 1986. It is clear from the first panel that there was an upward trend in the standard of living from 1950 to 1983.
As a contrast to the Philippines, the following figure provides a similar decomposition for Viet Nam – a late-comer, which overtook the Philippines. For Viet Nam there is an 85.3% probability that there are four changepoints, three of which have a probability in excess of 0.95: 1976, 2004 and 2010 (the fourth is 1991 with a probability of 80%). Yet, the fourth panel shows all ‘red’, so all these changes in trend were positive.
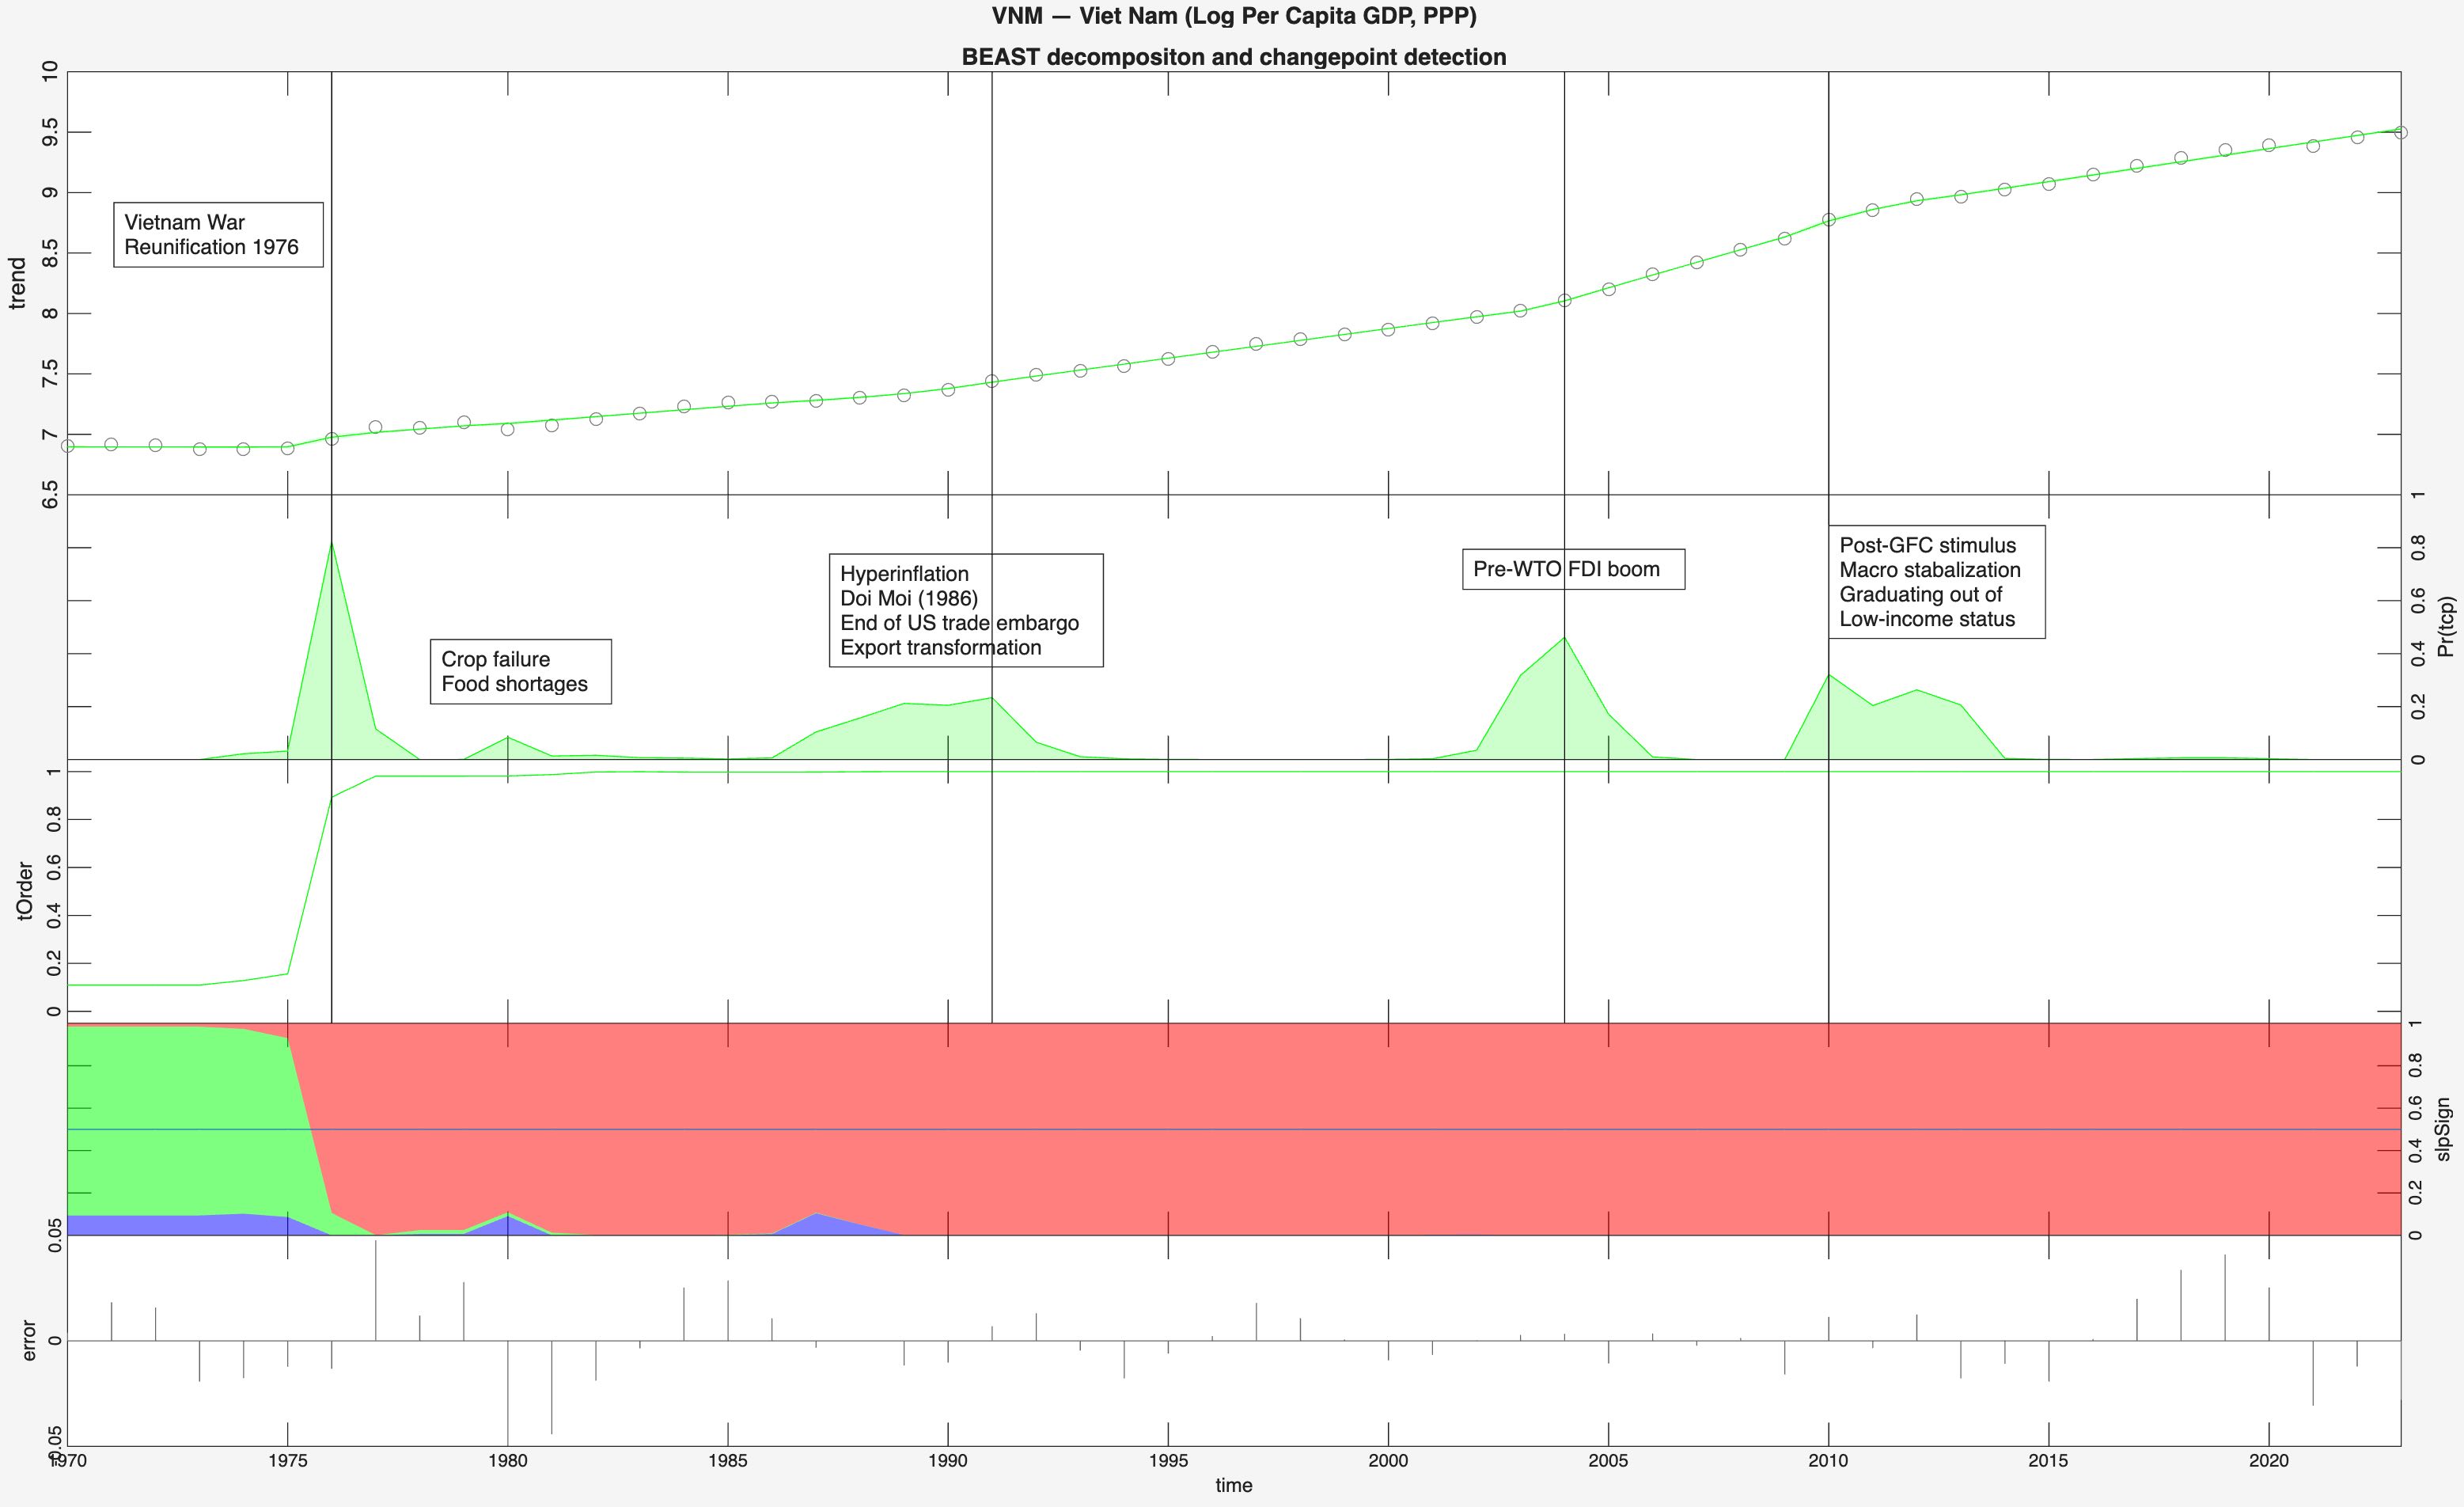
Since the unification of Viet Nam 1976, the trend in the standard of living has been positive and rising. Prior to that, the fourth panel shows green or a flat trend (stagnation in the standard of living). Was Vietnam not impacted by the Asian financial crisis or the Covid pandemic? It was, but the turbulence at the surface did not fall to the bottom line. There were domestic challenges as well. There was a border war with China in 1979; the country was on the brink of famine in 1980; and there was the collapse of the Soviet Union in 1991 which was the primary source of financial aid and trade for Viet Nam. On the economic front. There was hyperinflation in the mid-1980s; the Doi Moi reforms in 1986; the end of the US trade embargo. None of these events show up as resulting in a decline in the standard of living of the Vietnamese people.
These figures identify major structural failures — the prolonged reversals — rather than differences in the pace of progress. The table of per-capita GDP levels provides the necessary complement: it tells us not just the direction but how far each country has actually travelled.
Readers can draw their own conclusions. My learnings are as follows:
- When the foundation (or the structure) is weak as in the Philippines, top line turbulence (GDP growth) shows up in the bottom line (standard of living).
- When it comes to building prosperity, political (and policy) stability is more important than the political system. The Philippines case shows rising standards of living during a dictatorship and two decades of decline during democracy (or plutocracy). Like China, Viet Nam is a socialist (Communist if you prefer) country.
Balikatan 2026 was conducted with ‘American friends’. Well, this is what they think of the Philippines:
Travel in the Philippines too often feels “more hassle than fun” (Former US Executive Director at ADB in Manila – quoted in ST).
“The Philippines is probably one of the hardest places to invest in…”. The Philippines has “some of the worst investment conditions in Southeast Asia” for manufacturing. (CEO of Livy AI – quoted in SCMP).
So, the Philippines is not a good place to visit or to do business, but it is perfect for setting up military bases and fermenting potential conflict in the region.
May be its time for Bongbong Marcos to put down his gun, make new friends, and learn how to fish for his people. They will thank him for it.
Notes
The Penn World Tables do have data going back to 1960 in many cases, if not to 1950. I use 1970 as a starting date in the table since data for Viet Nam is not available prior to that date.
The natural log of per-capita GDP (PPP) is used in the trend decomposition.
Sources
CNA Insider: Tourists are skipping Philippines.
Straits Times: ‘More hassle than fun’: Philippines struggles to draw tourists as it lags regional peers in arrivals. January 4, 2026.
South China Morning Post: US Pax Silica hub plan hits Philippine sovereignty wall: ‘no special arrangement’. May 24, 2026
Zhao, K., et. al. (2019) Bayesian Estimator of Abrupt Change, Seasonality, and Trend (BEAST).

Leave a comment