
A recent report by the McKinsey Global Institute (MGI) on competitiveness compares China’s present and future competitiveness with that of the US and EU-27 economies. The report uses some fundamental concepts from the theory of economic growth to make its case. In addition to country level comparisons, it provides a detailed cross-country benchmarking of costs for ten industries.
Productive investment is a good measure of present and future competitiveness. Gross investment (sum of replacement and net investment) is a measure of current competitiveness since it shows that an industry at a particular location is able to successfully attract local and/or foreign resources (capital). Net investment is an indicator of future competitiveness as it adds to future productive and innovative capacity. In earlier work the MGI found that investment in productive tangible and intangible capital explains 80% of productivity growth. And it’s well known that productivity growth drives prosperity in the long run. Investment data are reported in 2024 (or most recent available) constant (real) dollars using 2024 market exchange rates.
Productive investment excludes investment in the residential structures. It includes both public and private investment in tangible assets such as in infrastructure, offices, factories, machinery and equipment and in intangible assets such as R&D and intellectual property (IP) products such software and databases.
The report compares investment at the national/regional level and identifies ten industries for detailed study. Industries are divided into three categories. Anchored industries are capital intensive and non-traded or local industries. The two anchored industries are nuclear reactors and solar photovoltaic production with battery energy storage systems (PV-BESS). The products of Footloose industries are traded in world markets. Four footloose industries included steel (produced using direct reduced iron-electric arc furnace: DRI-EAF), polyethylene, pharmaceuticals and battery gigafactories. The remaining four industries are classified as Arena industries which are located in ‘clusters’ where talent, infrastructure, investment and related and supporting industries are located in close proximity to each other. They include colocation data centers (AI excluding chips), automotive R&D (EV platforms), Biopharma R&D (fast-follower monoclonal drug discovery and development) and semiconductors (advanced-node fabs).
The report finds that by any measure of investment China outperforms the US and EU-27. In 2024 China’s gross investment was about (US) $ 5.9 trillion compared to the US at $5.1 trillion and EU at $3.1 trillion. Using purchasing power parity exchange rates increases China’s gross investment to $11.9 trillion and that of the EU to $4.5 trillion. Most of American and European investment goes to replacement investment and not to creating new productive capacity. At market exchange rates, net investment in China was $4.4 trillion in 2024 ($8.8 trillion if adjusted for PPP), more than three times as much as the US ($1 trillion) and EU ($400 billion ) combined. This is the real reason why China is forging ahead.
In 2024, the gross investment of Germany, France, Japan, South Korea and the UK ranged from $0.6 trillion to $0.9 trillion. Net investment ranged from roughly $0.006 trillion in Germany to $ 0.2 trillion in the UK. For each of the other countries mentioned above it was about $0.1 trillion. As a percentage of GDP, in 2024, net investment in China was 23%. For the other economies and regions mentioned above, it varied between 0.2% and 4%.
This is not something that has happened suddenly. China has been pulling ahead since 1995 when net investment in the US, EU-27 and China was roughly the same. Since 2000, there is a clear acceleration in the upward trend for China. The US has moved sideways and the EU-27 economies have been on a declining trend, particularly since 2008. The report observes that “the scale and persistence of China’s net investment remain exceptional”. As competitiveness guru Micheal Porter says: competitiveness is about consistent upgrading – it is a hard slog.
According to the report the downside of high investment in China is that it lowers the (marginal) productivity of capital and therefore the return on capital (diminishing returns). The return on capital in 2024 is 0.6 in EU-27, 0.5 in the US and 0.3 in China. I am a bit befuddled about this for two reasons. Firstly, it is well known that the relationship between R&D investment and corporate profits shows an inverted u-shape, but that is usually attributed to obsolescence and competition. Moreover, R&D investment has the potential to produce increasing returns (software) and positive externalities. Secondly, the report measures the economic return on productive capital stock as $ of output per $ of productive capital stock. This is the inverse of the capital-output ratio. The correct measure is the incremental capital-output ratio (ICOR), or the amount of capital needed to produce one additional unit of output. The marginal product of capital is the inverse of ICOR not of the capital-output ratio.
Luckily, the IMF comes to the rescue. They find that the ICOR has increased (particularly since 2008) not just in China but also in most ASEAN economies; in emerging markets in the rest of the world; and in low-income developing countries in the rest of the world. They find that the “rise in misallocation in Asia mirrors that in Europe”. The US appears to be the only country where capital misallocation has declined over the period 2009-19. The measure of misallocation used by the IMF is the dispersion in the marginal revenue product of capital (MRPK) across firms within sectors. MRPK is the extra nominal revenue generated by one additional unit of capital. In the Asia Pacific region, they attribute the misallocation to inefficiencies in financial intermediation. I reproduce two figures from the IMF regional economic outlook below.
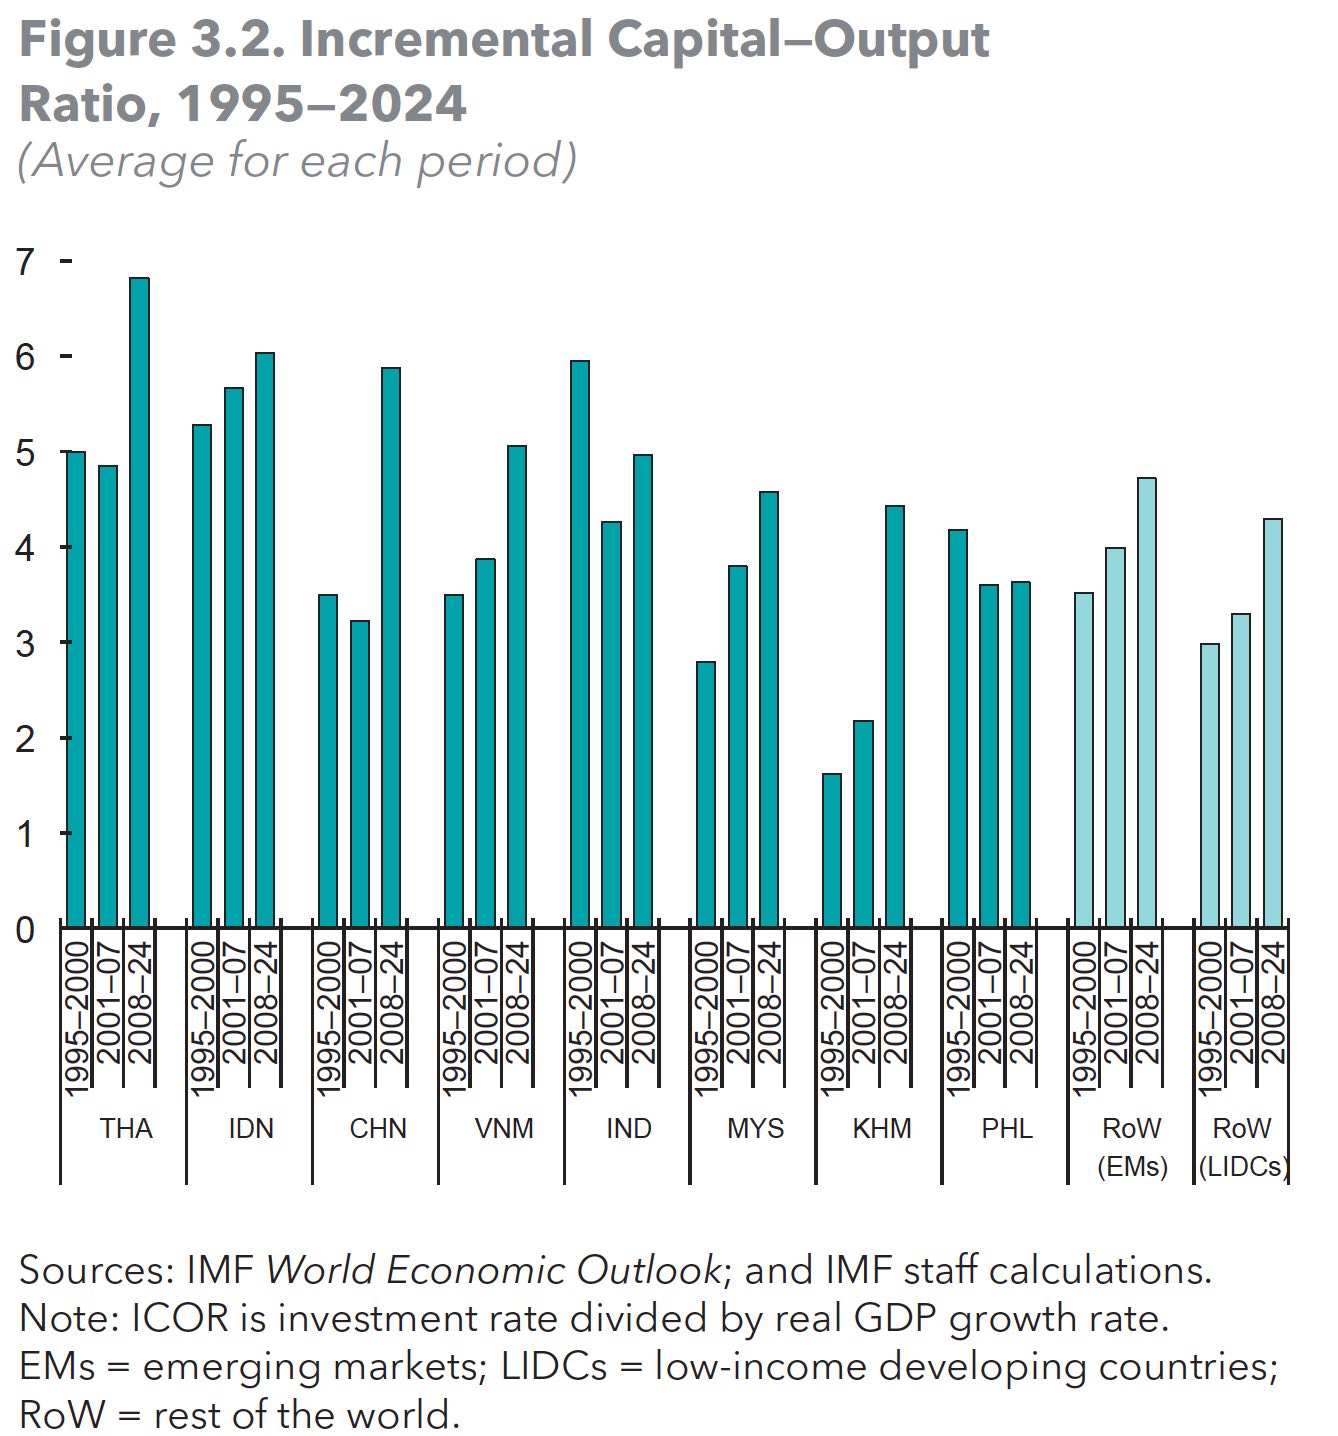
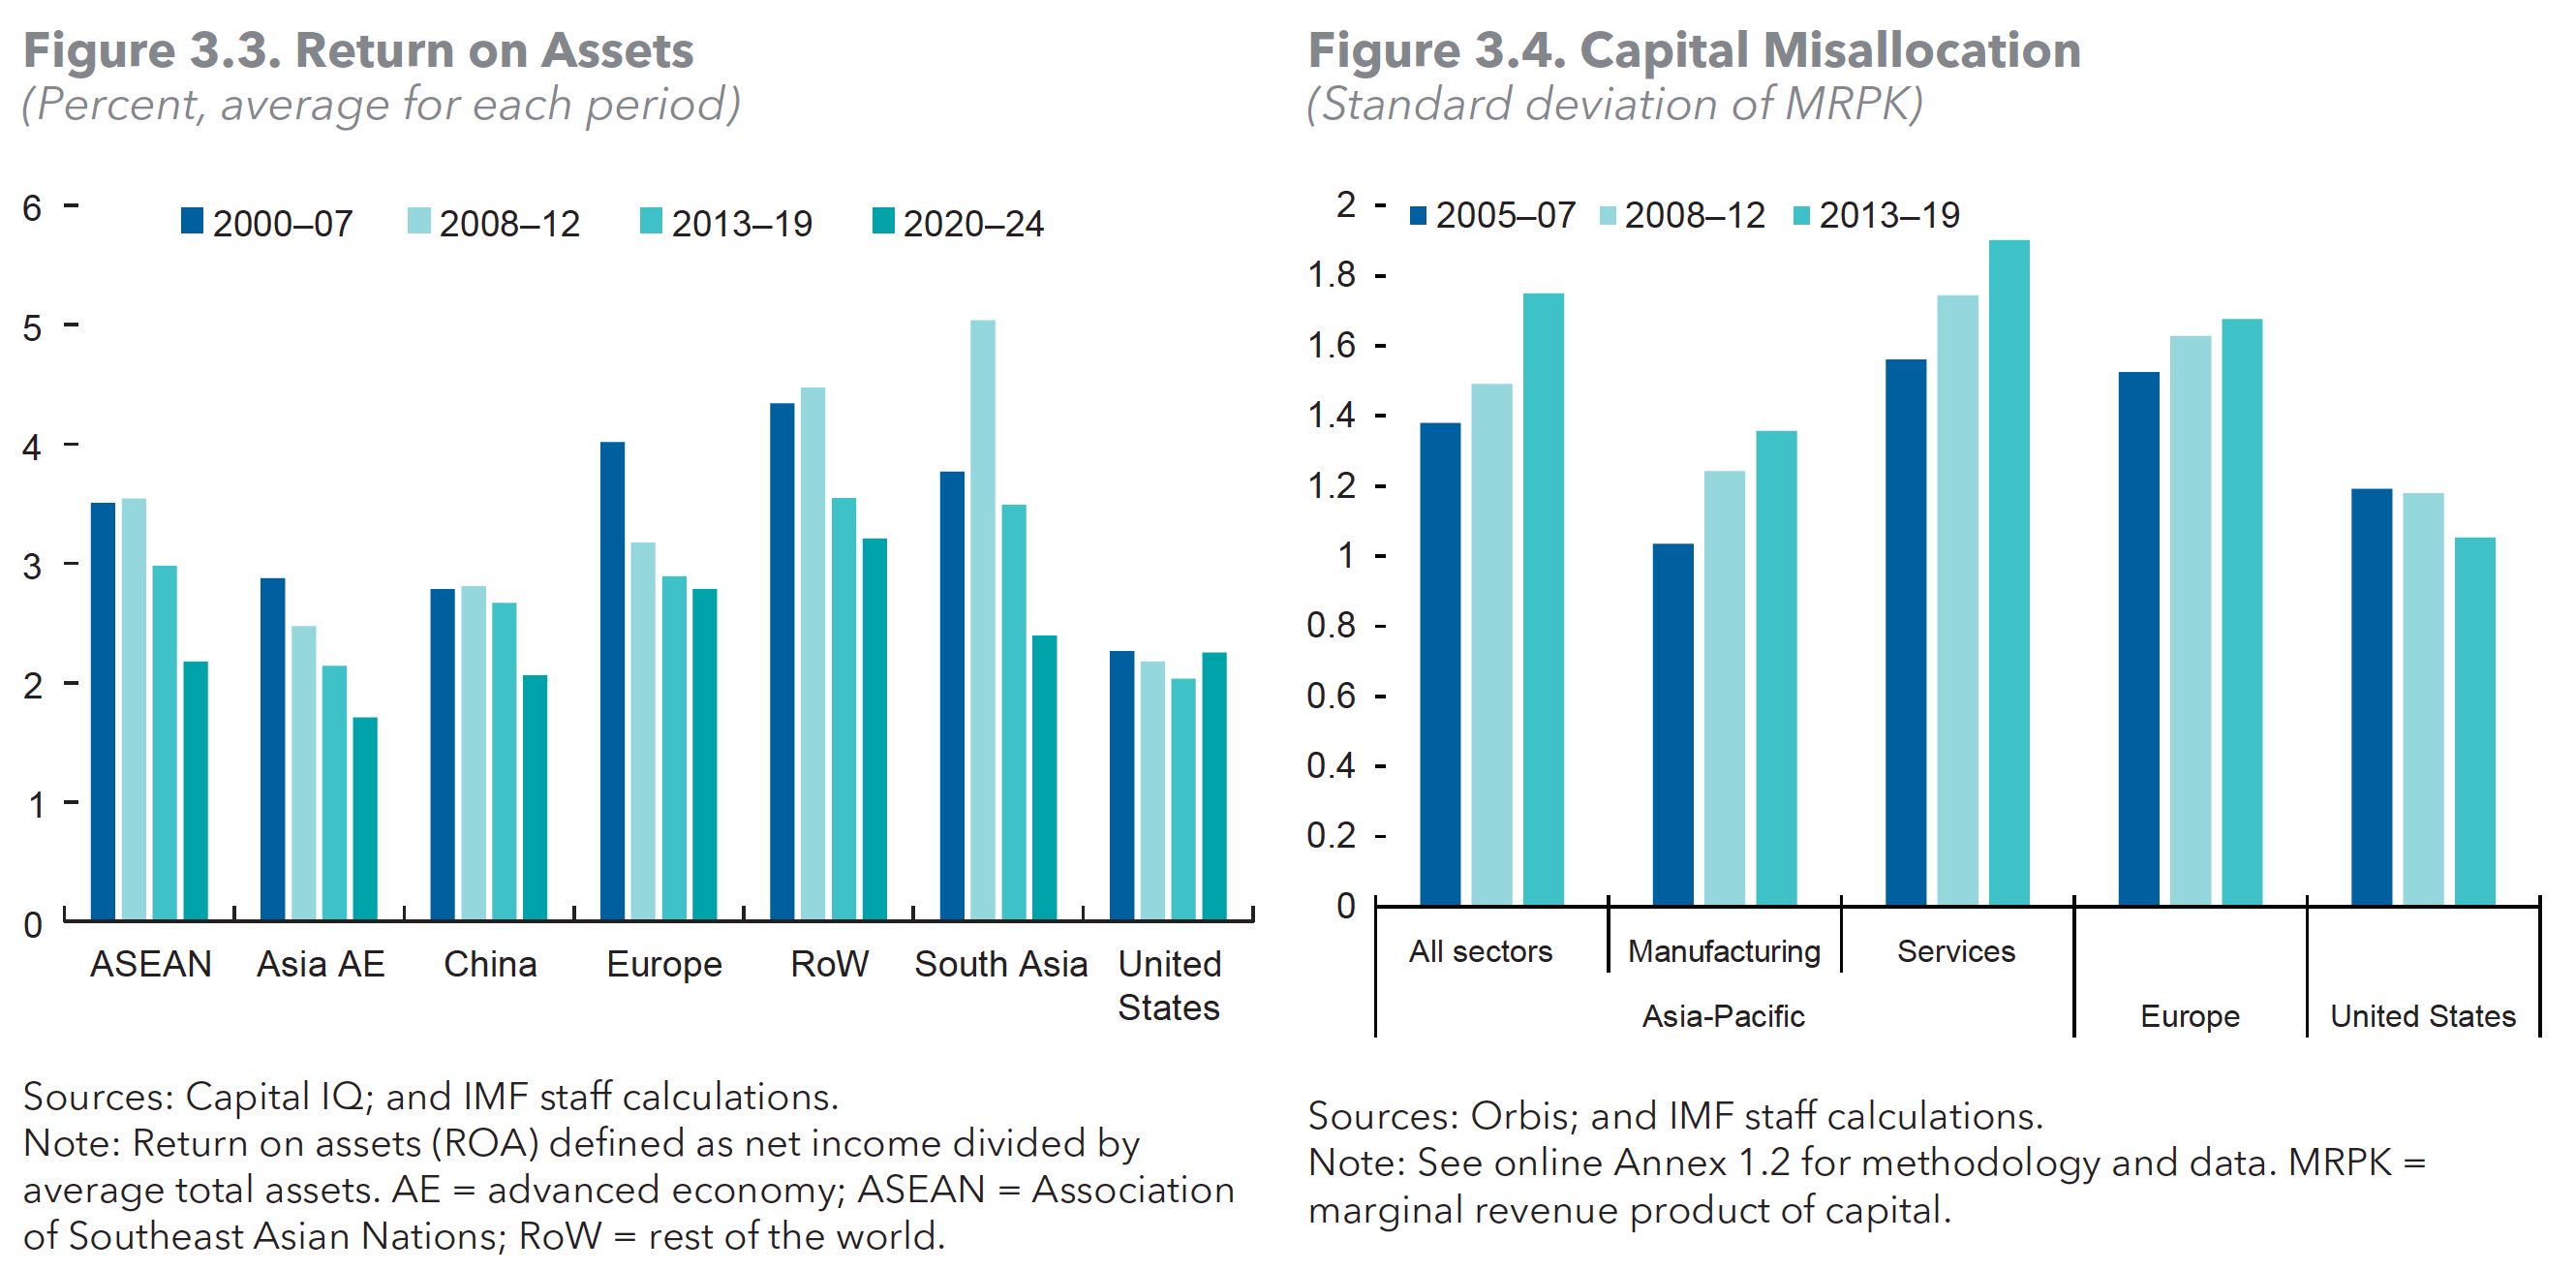
Looking across sectors, the broad results are unsurprising since China leads in manufacturing and the US leads in services. About 63 cents of every dollar invested in the global machinery sector in 2024 (or 63%) was invested in China. And the same for 53 cents of every dollar invested in the electronics industry and 41 cents for basic manufacturing such as steel. The US attracts 53% of the world investment in the ICT industry, 51% in financial services and 29% in professional and other services. The EU-27 economies are stuck in the middle and likely to continue falling behind. The report observes: “Countries that consistently invest more than their current production tend to gain output share over time”.
The cost positions of “best in class” countries for the ten industries are compared using the notion of long-run marginal costs (capacity and operating costs). The report uses the unit price that would make the project viable to estimate ‘levelized cost’. In other words, it finds the unit price at which the net present value of the project over the life cycle of the project equals zero. China has the lowest cost in seven of ten industries. Saudi Arabia is the lowest cost producer of polyethylene; Oman leads in steel produced using electric arc furnaces and Taiwan leads in semiconductors. For nuclear power, costs in South Korea and China are practically identical. In comparison, costs in the US and Europe are anywhere from 50-300% higher. Costs per megawatt are three times higher for new French nuclear plant compared to one in South Korea or China. Similarly developing a new EV platform is three to four times more expensive for a legacy American or German car company compared to a Chinese one. So, you don’t invest that much in new productive capacity and you are a high-cost producer – how can you compete?
The report also finds that that in many industries, the cost gap between countries is often not explained by the differences in cost of the main cost driver. ‘China speed’ also matters. In the case of nuclear power differences in construction costs explain 60% of the cost differential between France and China or South Korea, but this is not only due to input cost differences. China can complete a project in 70 months(~6 years), South Korea in 100 months(~8 years) whereas in Europe and the US it may take up to two decades – large European countries have the longest project timelines. Similarly building a new semiconductor fab in Germany or the US costs twice as much as building one in the US. Chinese biotech firms can launch a drug two years earlier than their European and American counterparts.
Labour costs account for 66% of the cost differential between the US and China in pharmaceutical manufacturing and almost 50% of the cost gap between Taiwan and Germany in semiconductor fabs. Compared to China and Taiwan, labour costs are generally two to three times higher in the US and Europe (10x for steel workers) but they are not matched by higher productivity. In semiconductor fabs, Taiwan beats the US in both wages and productivity. Taiwanese engineers earn 2.5 times less than those in the US and are 1.25 times more productive. So, you don’t invest that much in new productive capacity; you are a high-cost producer; your workers are overpaid and less productive; and you are slow – how can you compete?
Another Porter dictum is that: everything matters for competitiveness. The report finds that for colocation data centers; Sweden has the second lowest costs at $223 /MWh (after China which has the lowest costs: $198/MWh) and Singapore has the fourth lowest costs at $315/MWh. Energy costs are the main cost driver for data centers and these are lower in Sweden than in Singapore. Yet despite this cost-disadvantage, Singapore has more data centers than “it should” and Sweden has less than “it could”. This is explained by “markets and ecosystems, as well as fast permitting and building”. Speed of execution is critical for data center projects.
In the future of course more data centers will be built across the causeway in Johor (Malaysia) since Singapore won’t be building anymore. Malaysia is the only other ASEAN economy mentioned in the report. After China, it has the second lowest costs in LFP (lithium ferro phosphate) batteries manufacturing. The cost differential is small as costs in Malaysia are 1.1 times those in China. This provides anecdotal evidence to support the case that there is still room for ASEAN even if China is more efficient. The ‘flying geese’ model may still work, maybe differently than it did earlier because China has a much larger domestic market than Japan or South Korea. The complexity literature also tells us that countries with a higher population produce a larger number of products.
So how can Europe and the US close the gap given that China has an advantage across most factors of production? Here the report makes many “heroic” assumptions. It finds that 30 to 80 percent of the cost gap could be closed if productivity were to increase by 30%; if costs of equipment, energy and materials in Europe and the US would converge with those in China (this after finding that Europe has a structural energy cost disadvantage); and if Europe and the US could adopt “China speed”. In simple terms: It’s highly unlikely.
What should we expect? I think more Western tropes and fake narratives blaming China for everything (most recently the Economist magazine calling cleaning up the Yangtze River “eco-authoritarianism”); and more racism (most recently from the Foreign Minister of New Zealand). More reactive and arbitrary trade barriers to keep Chinese goods out of their markets (most recently Chinese made inverters). More subsidies to declining industries and/or to industries which have a weak or no competitive position without thinking about the fiscal impact or the impact on costs and prices.
Notes
Exhibit 2 in the report shows German net investment as being zero trillion dollars. I have treated that as rounding and used information from page 19 of the report which states German net investment in 2024 was 0.2% of GDP. I use this percentage to derive the approximate dollar figure I report above: $0.00662 trillion.
Sources
Image of Shanghai: magnific.com
Hidalgo, C.A., & Hausmann, R. (2009) “The Building Blocks of Economic Complexity”, PNAS, 106(26), 10571-10575.
IMF (2025) Regional Economic Outlook Asia Pacific (October), Chapter 3.
McKinsey Global Institute (2026) Catalyzing competitiveness: Where investment happens and why (June 30).
News reports
The article in the Economist is dated July 27, 2026: “China’s mightiest river is back from the brink: But eco-authoritarianism is not all roses”. See also a related article.
NZ Foreign Minister racist remarks
US and EU ban on power inverters
Industrial policy


Leave a Reply