
Since a very large proportion of ASEAN’s trade with China is in intermediate goods, I continue my data exploration exercise from the previous post.
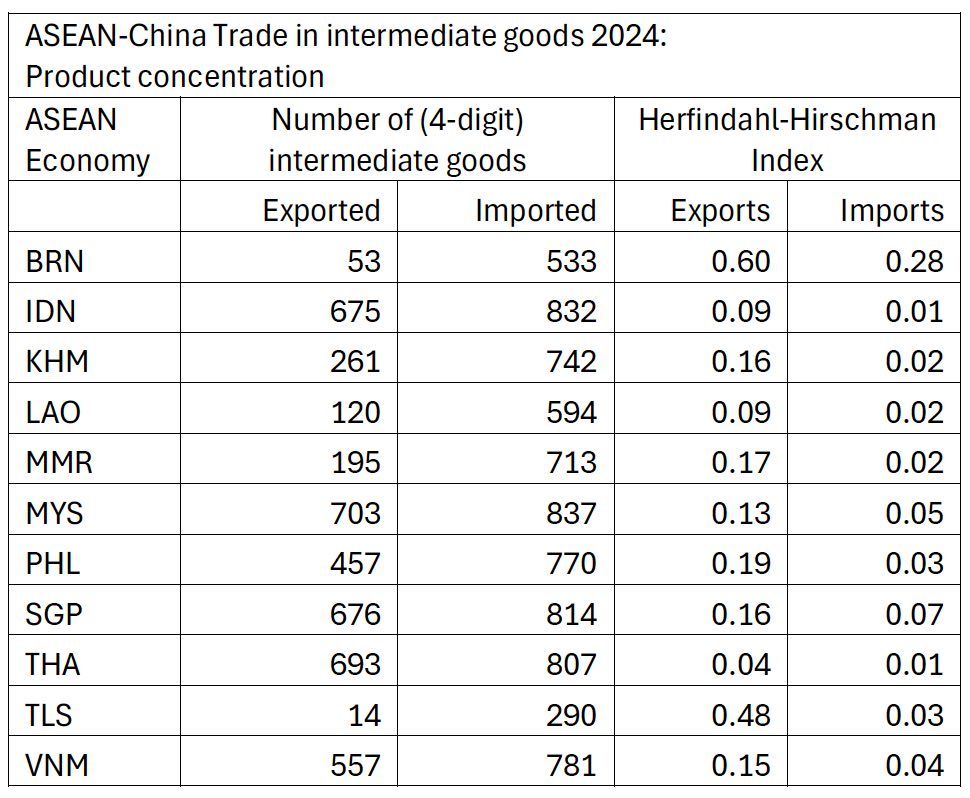
I start with all eleven ASEAN countries but aggregate up from the six to the four-digit level to make things more manageable. The following table shows that every ASEAN economy imports a much wider range of (intermediate) goods from China than it exports to China. The Herfindahl-Hirschman Index (sum of square of export/import shares) shows more concentrated export baskets for every ASEAN economy regardless of the diversity of goods exported. This may be attributed to China’s size and capabilities. As the complexity literature indicates, more diversity (number of good exported) for a small country like Singapore shows higher capabilities or a higher economic complexity index ranking (6th), compared to Indonesia (70th), Malaysia (24th) and Thailand (30th).
An examination of export/import shares in 2024 as well changes in shares (gains and losses) between 2017 and 2024 reveals two patterns of trade. The first may be called resources for manufactures which include Lao PDR, Myanmar and Timor Leste. The second may be called the electronics-IC production network or value chain which shows intra-industry trade in two HS categories (8541 and 8542; electronic integrated circuits, and diodes and semiconductors) This group includes Malaysia, Philippines, Singapore, Thailand and Vietnam. Some of the economies in the second group also exported some resource-based products: Philippines – nickel and copper, Malaysia – petroleum, and Thailand – rubber and rubber products.
Lao’s main exports were fertilizer (potash) and iron and copper ores and main imports included iron and steel products, wire and cable products and chemicals. Petroleum products and rare earth metals accounted for about 53% of Myanmar’s exports in 2024; imports were primarily fabrics. Coffee accounted for 59% Timor Leste’s exports in 2024, imports included steel products used in construction and plastic products.
Cambodia’s main exports include tanned furskins, copper and granite products and imports were primarily fabrics. Cambodia has an overlap with China in wire and cable products. Indonesia exported, coal, nickel and ferro-alloys and imported iron and steel products, telephone sets and transmission apparatus (HS: 8517), wire and cable products and electronic ICs. I include both in the first group since resources dominate and most of the trade in electronics is one-way (imports from China).
That leaves Brunei, which is petroleum story, although it is upgrading within the same sector, gaining export share in cyclic hydrocarbons, while losing share in crude oil. For the resource-based economies, the gains and losses in exports/imports between 2017 and 2024 are reallocations within the broad resource sector. Indonesia also shows export share losses in resources. China’s exports of different types of fabrics and knitwear lost share in Cambodia, Indonesia and Myanmar.
Those in the electronics network showed either gains and/or losses in the two categories mentioned earlier electronic ICs and diodes and semiconductors (HS: 8541 & HS 8542). China also gained export market share in electronics related products for some economies in the resource group. For Cambodia the biggest import (China’s export) gainer between 2017 and 2024 was diodes and transistors (HS: 8541) and for Lao PDR, the second largest import gainer was dopes chemicals used in electronics/discs/wafers (HS 3818). In the case of Indonesia China gained export share in electronic ICs (HS: 8542) and lost share in telephone sets and transmission apparatus (HS: 8517). It is possible that these three economies are just beginning to diversify into electronics, the opportunity to plug-in is definitely available both via ASEAN and RCEP.
Electronics value chain
For the five ASEAN economies I look at six-digit level data for the following three 4-digit categories: HS 8541 (diodes, transistors), HS 8542 (electronic ICs) and HS 8517 (telephone sets and transmission apparatus) to examine changes in export and import shares. While I am on the subject of telephone sets (HS: 8517) , it is important to note that only intermediate goods are included above. They do not include personal cellular phones which are classified (in OECD-BTiGE) as a “mixed end-use product” (HS 6-digit: 851713). Vietnam’s cellular phone exports to China increased from USD 8.4 million in 2017 to 24.1 billion in 2024. The share of Vietnam’s cellular phone exports in total exports to China, increased from 0.02% in 2017 to 25.6% in 2024.
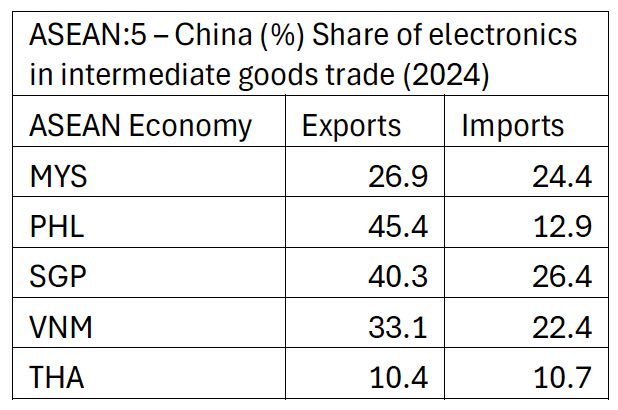
The following table shows the share of electronics in ASEAN:5-China trade in intermediate goods. With the exception of Thailand, export shares exceed import shares and Thailand has the lowest export and import shares. Trade with China in this product group is most significant for Singapore and Vietnam.
With the exception of Singapore, the trade balance of the other four economies (with China), deteriorated between 2017 and 2024; by roughly USD 4 billion for Philippines and Thailand, 7 billion for Malaysia and 13 billion for Vietnam. Singapore’s’ trade balance improved by 0.7 billion.
Between 2017 and 2024, China’s export share (in intermediate exports) increased in most of the six-digit electronics categories for all the above AESAN economies with the exception of Malaysia. China lost export share in seven of fourteen 6-digit product categories. The biggest losses were in electronic-ICs processors (-2.6%) and associated parts (-1.8%) and the biggest gains were in electronic-IC memories (5.4%) and other electronic-ICs (4.7%). Malaysia lost export share in eleven of fourteen categories, but Malaysia’s own exports to China show a similar pattern in the same categories: electronic-ICs processors (-9.7%), associated parts (-2%) and electronic-IC memories (0.4%).
Looking at the exports of the other four economies, Singapore and Vietnam are similar in that they gain export share in most categories (9-11 of 14) and lose in a few. For Singapore losses are few and small; the biggest gain is in electronic-ICs processors (5.4%). For Vietnam the biggest loss is in telephone sets and transmission apparatus (-31%), and the biggest gain in other electronic-ICs (9.9%). Somewhat similar to Malaysia, Vietnam’s imports of telephone sets and transmission apparatus declined as well (-7.8%) and electronic-IC memories increased the most(6%).
Export shares of the Philippines declined in in twelve of fourteen 6-digit categories and in nine of fourteen Thailand. The difference is that for the former, the gains are miniscule and the losses, much larger. Thailand’s biggest losses are in electronic-ICs processors (-2.5%) and telephone sets and transmission apparatus (-1.5%), and in other electronic-ICs (2.5%) and parts of electronic ICs (0.24%).
Electronics Network
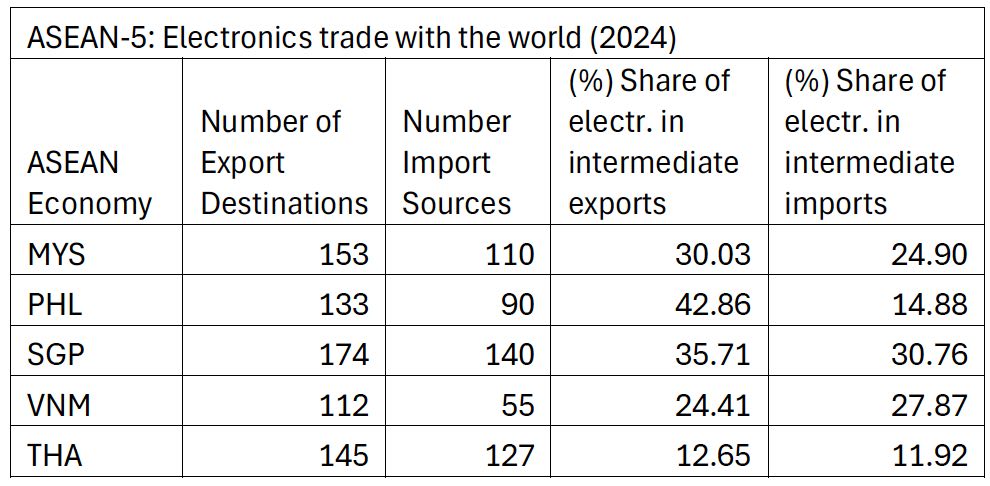
These five ASEAN economies are not only integrated with China in the electronics but participate in a wider global network which is anchored in East Asia. I examine their trade in electronics with the rest of the world. The following table shows the size of the network and the importance of these products in trade of the five ASEAN economies.
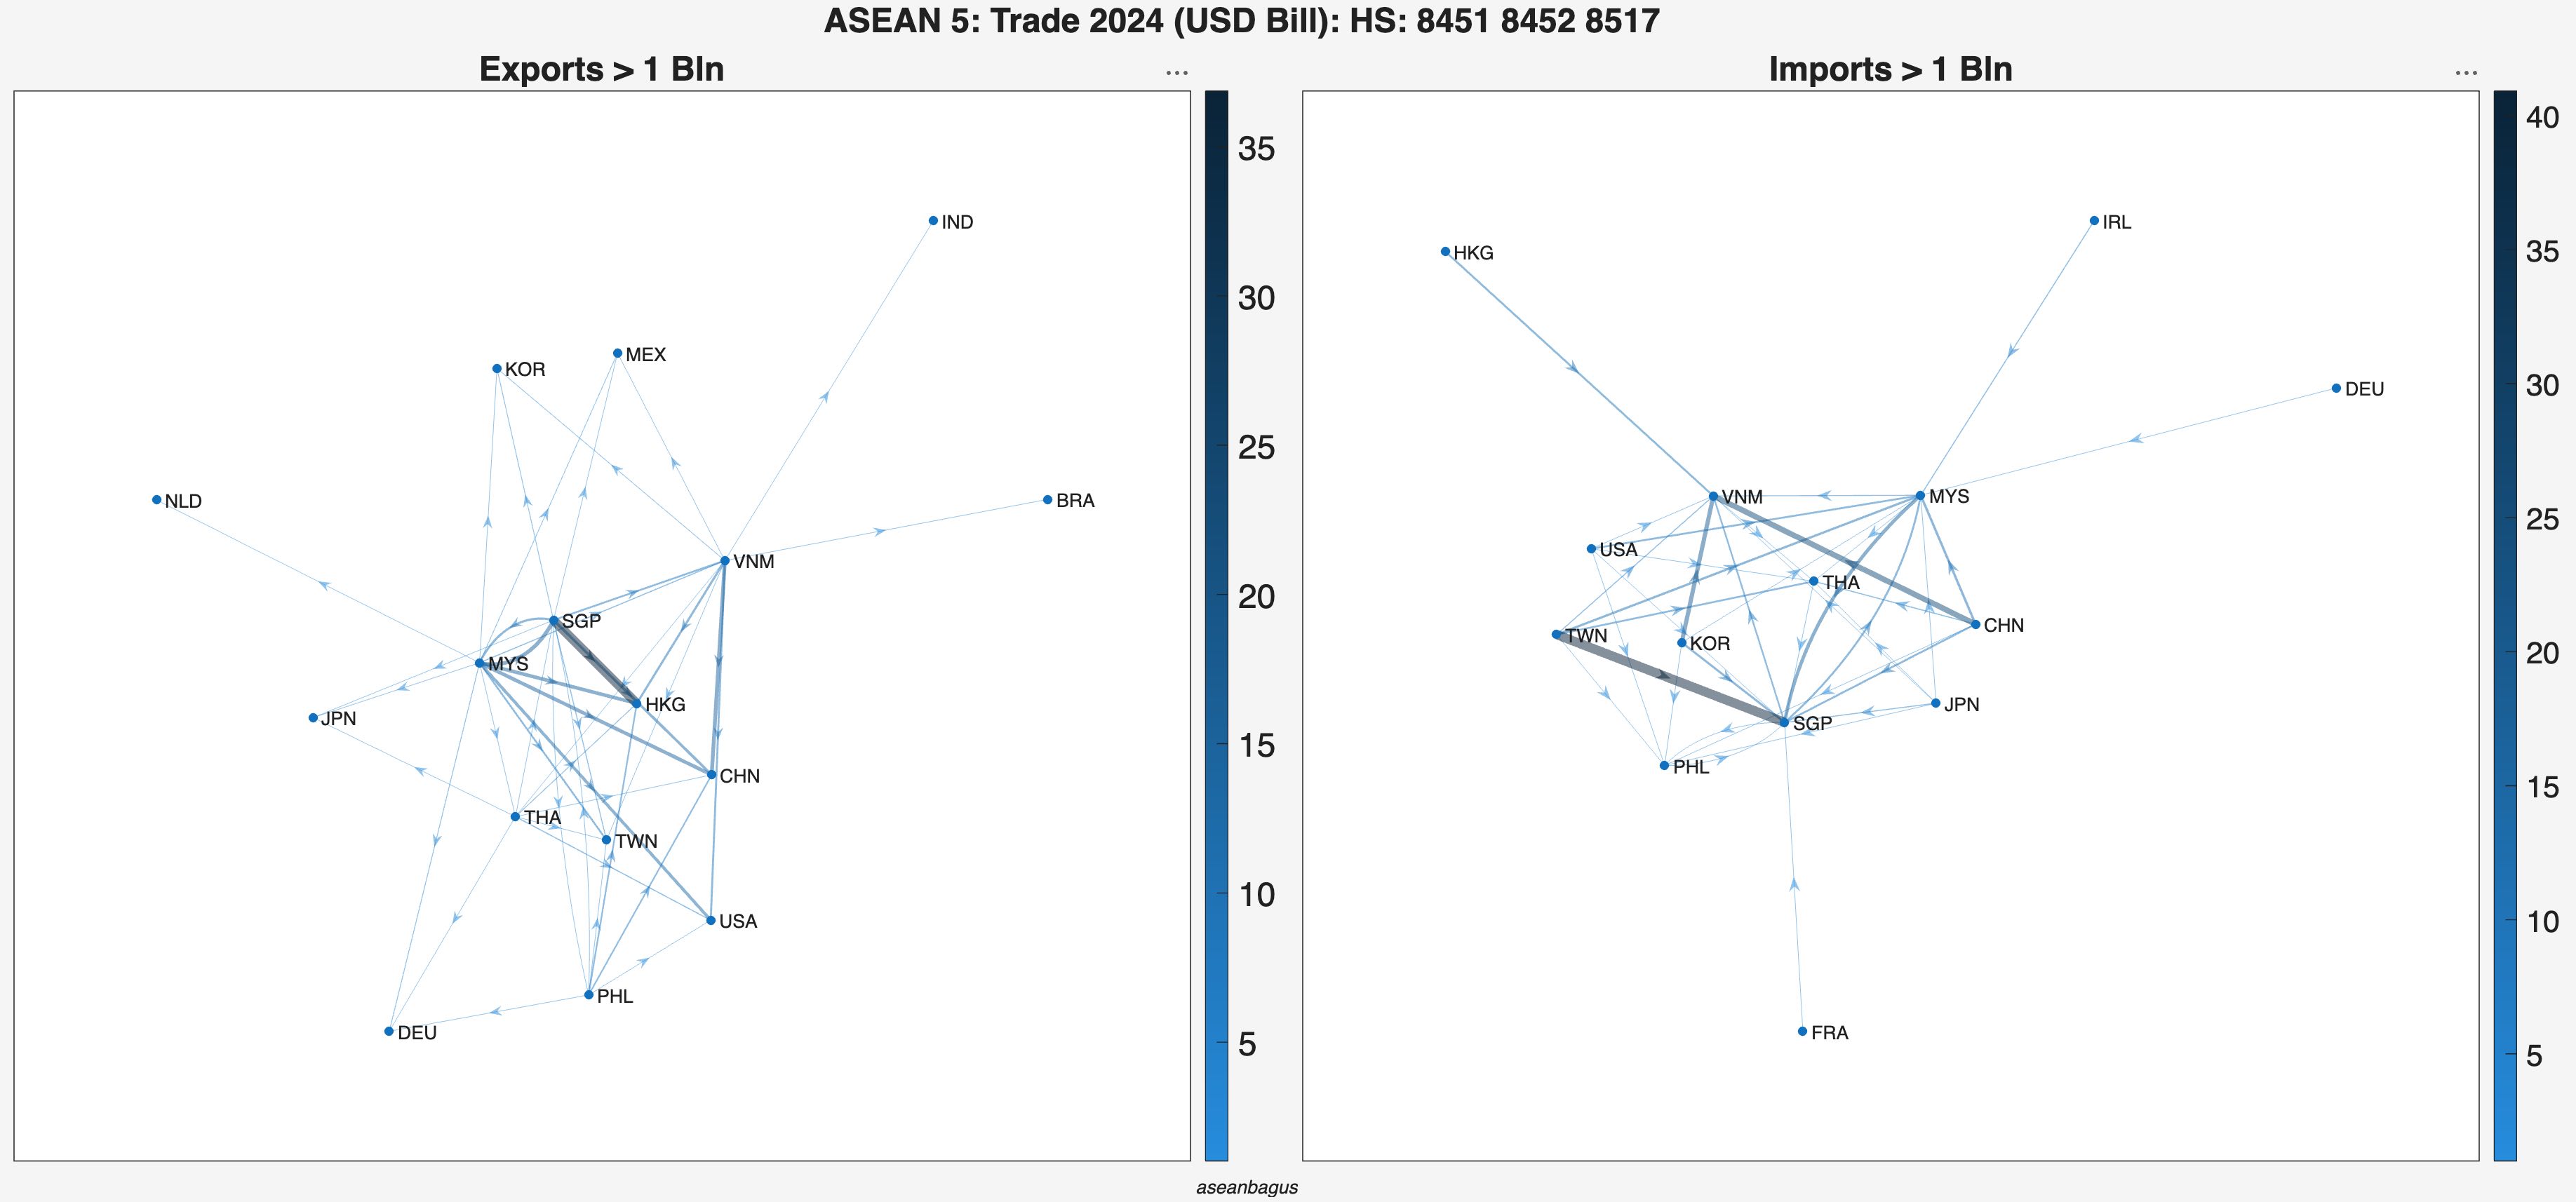
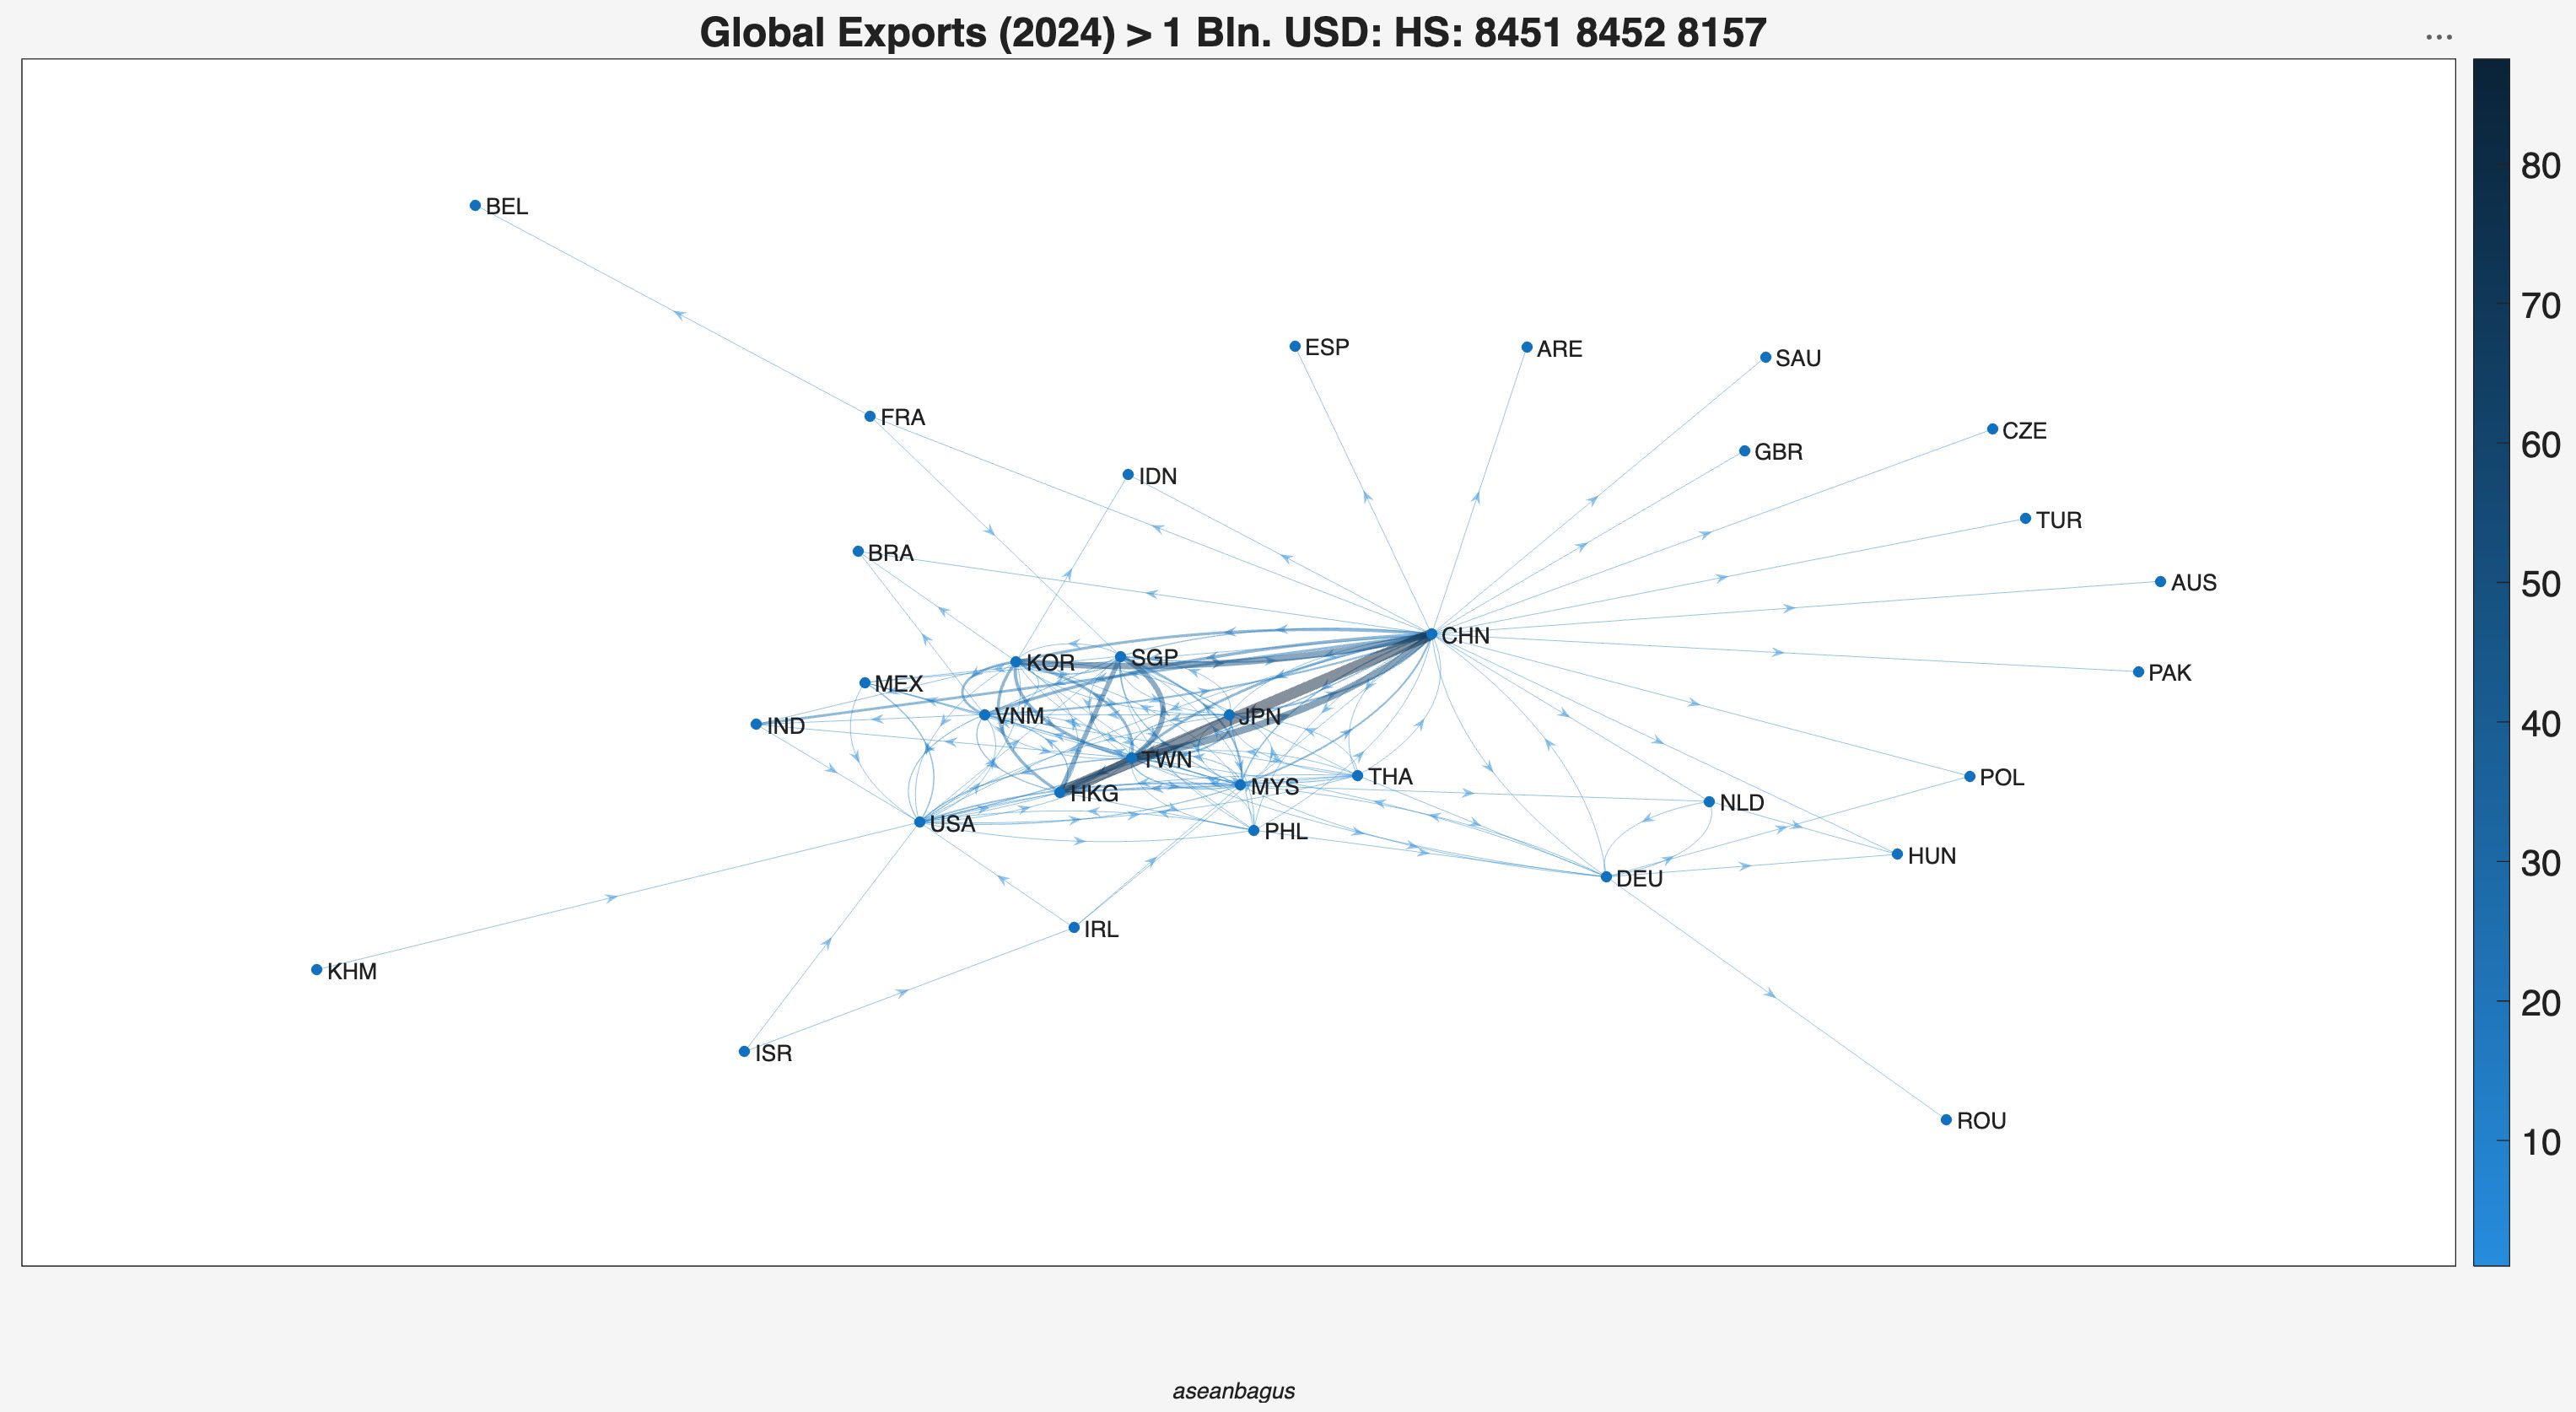
To avoid clutter, the following network graph shows transactions in excess of USD 1 billion. Singapore is clearly the dominant player in ASEAN, but I can’t explain the Singapore-Hong Kong and Taiwan-Singapore flows.
The global network is China-centered and is shown below. Global exports are the same as global imports since the BACI dataset is balanced.
Sources
Photo credit: Jeffry Surianto (Pexels).
Complexity Rankings 2024: OEC
OECD: Bilateral Trade in Goods by Industry and End-use Category (BTiGE) – Conversion Key.
Trade data: BACI HS 2017 balanced trade dataset.


Leave a Reply