
Developing and emerging economies often frame trade policy around increasing domestic value added in products they export. Indonesia would like to do more nickel refining at home rather than exporting nickel ore. Brunei would like to ‘upgrade’ or ‘move up the value chain’ in oil and gas. Doing more at home is expected to lead to higher employment and potentially, technology diffusion and skills development. Like ‘gross’ trade flows, value-added trade runs in both directions. To get a fuller picture of how ASEAN’s trade relationships are deepening, I examine the evolution of ASEAN’s domestic value added embodied in the final demand of selected partners and the reverse flow from partners to ASEAN’s final demand.
I use one series from the OECD trade in value added (TiVA) indicators: Domestic value added (DVA) embodied in foreign final demand (FFD) to examine these trends. Since the TiVA indicators are based on multi-regional input output tables (MRIO), this indicator captures domestic value added that reaches other economies (directly) through exports of final goods and (indirectly) via exports of intermediate goods and/or participation in global value chains. Foreign final demand includes household expenditure, business investment, government spending (C+I+G). The OECD indicates that this reflects “export of value added” – or where (and how much) domestic value added is consumed (by households, business and government) in partner economies. Growth in domestic value added embodied in foreign final demand may grow due to high growth in the partner economy, due to re-direction of trade or because the exporting economy has been successful in moving up the value chain.
The use of the (OECD) regional aggregate EU-28 (which includes the UK) is done only to keep things manageable. Many economies in that group are (individually) not that important either as ‘export’ destinations or ‘import’ sources. Of course, the ranking of economies as export destinations differs from their ranking as import sources. Mexico is a good example. In 2022, it ranked eleventh as export destination (ASEAN domestic value added in Mexican final demand) but twenty-sixth as an import source (Mexican domestic value added in ASEAN final demand).
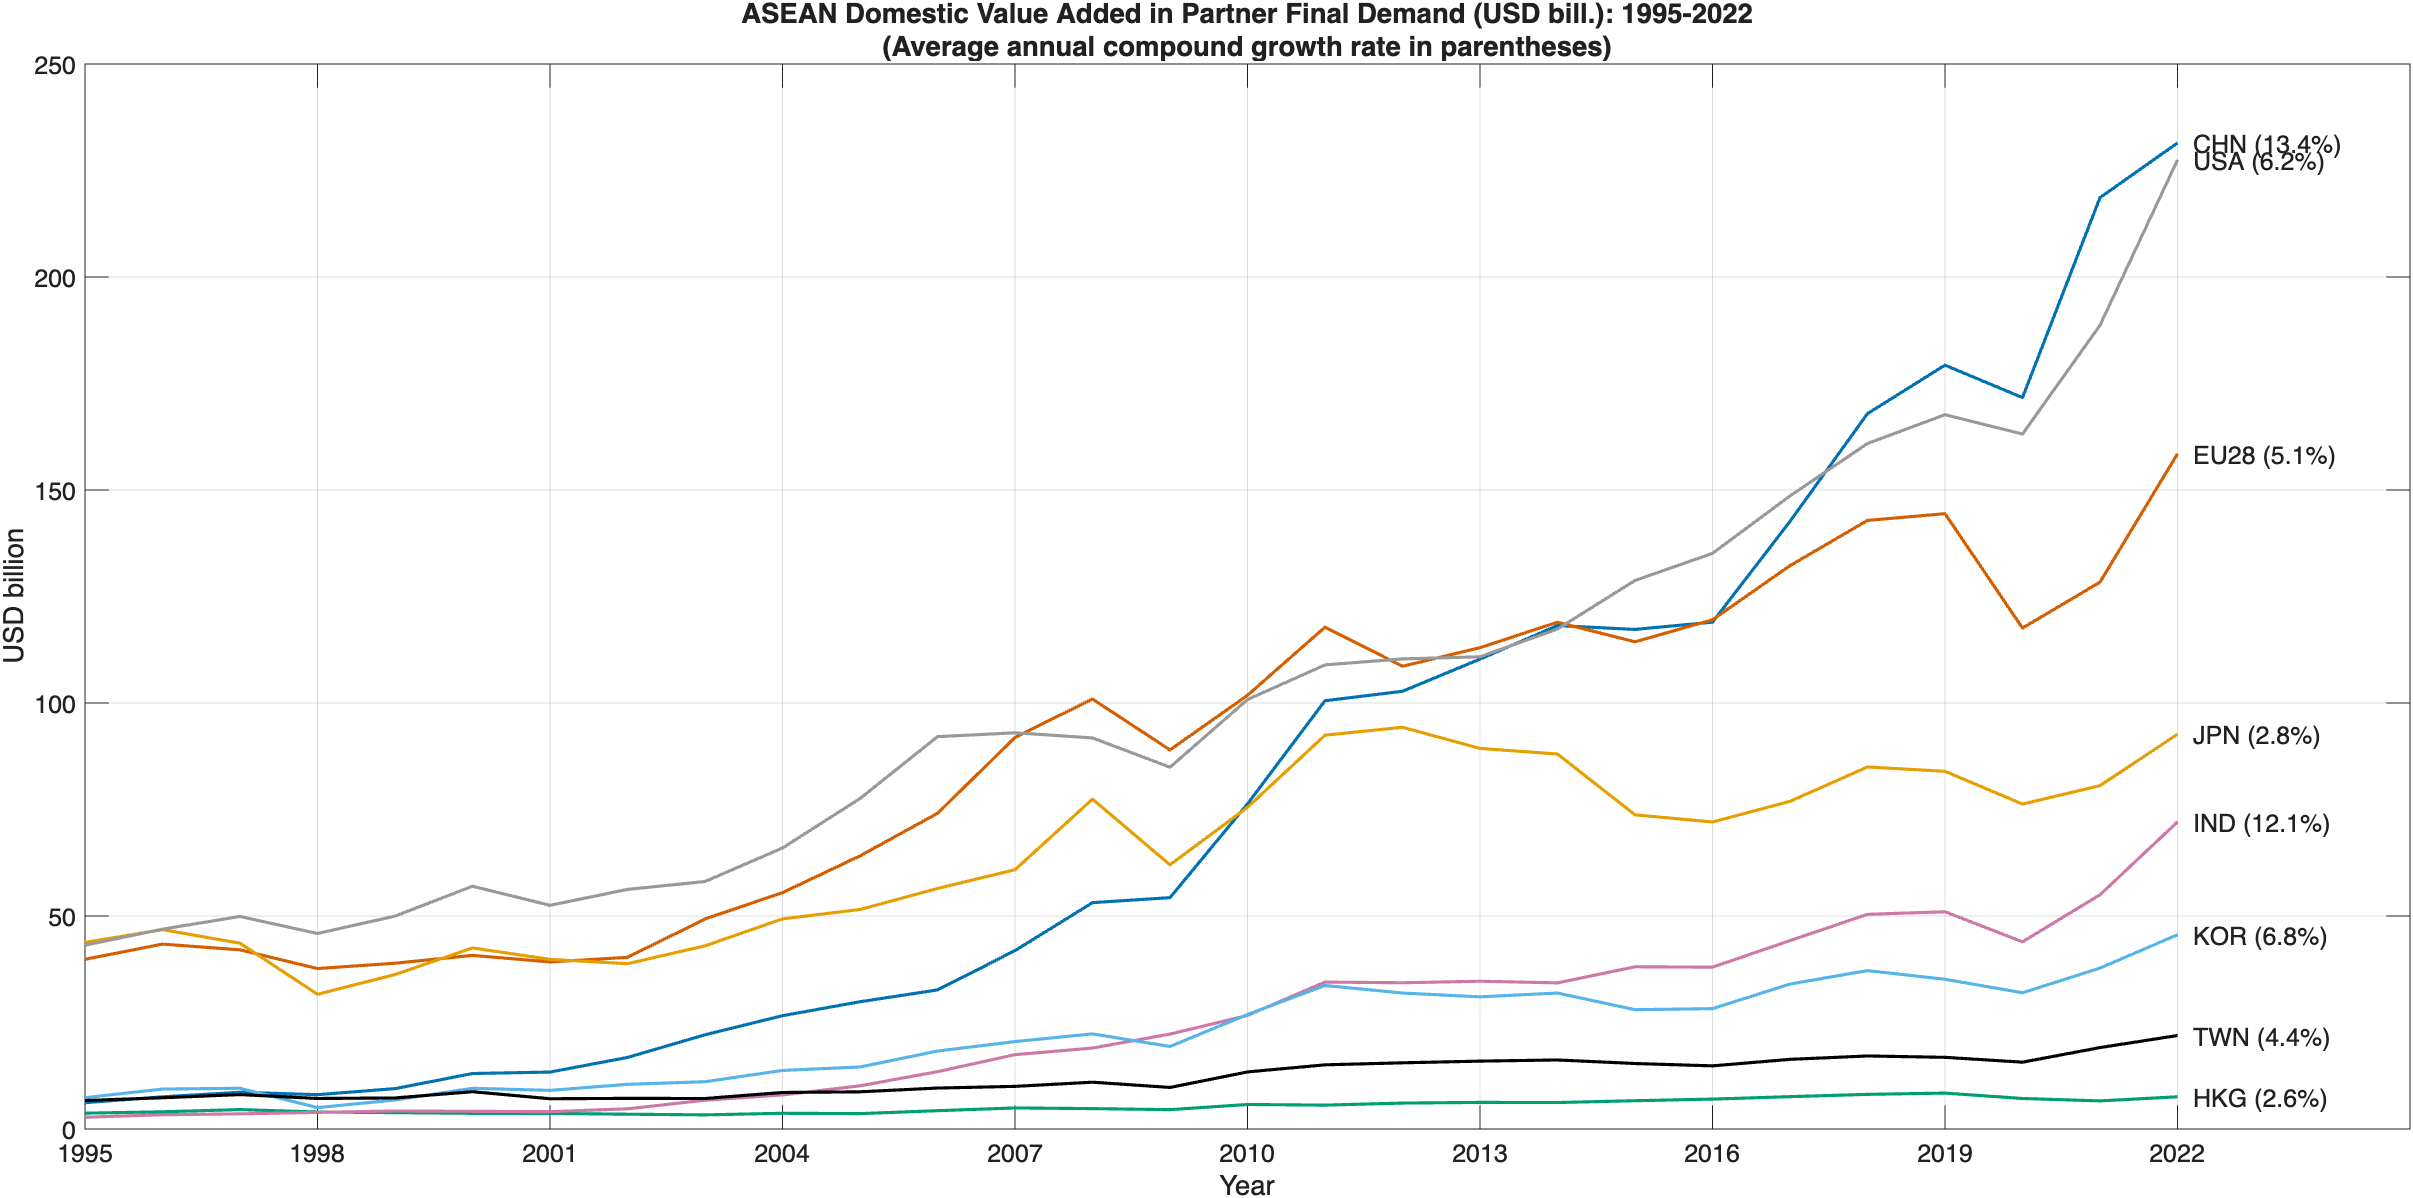
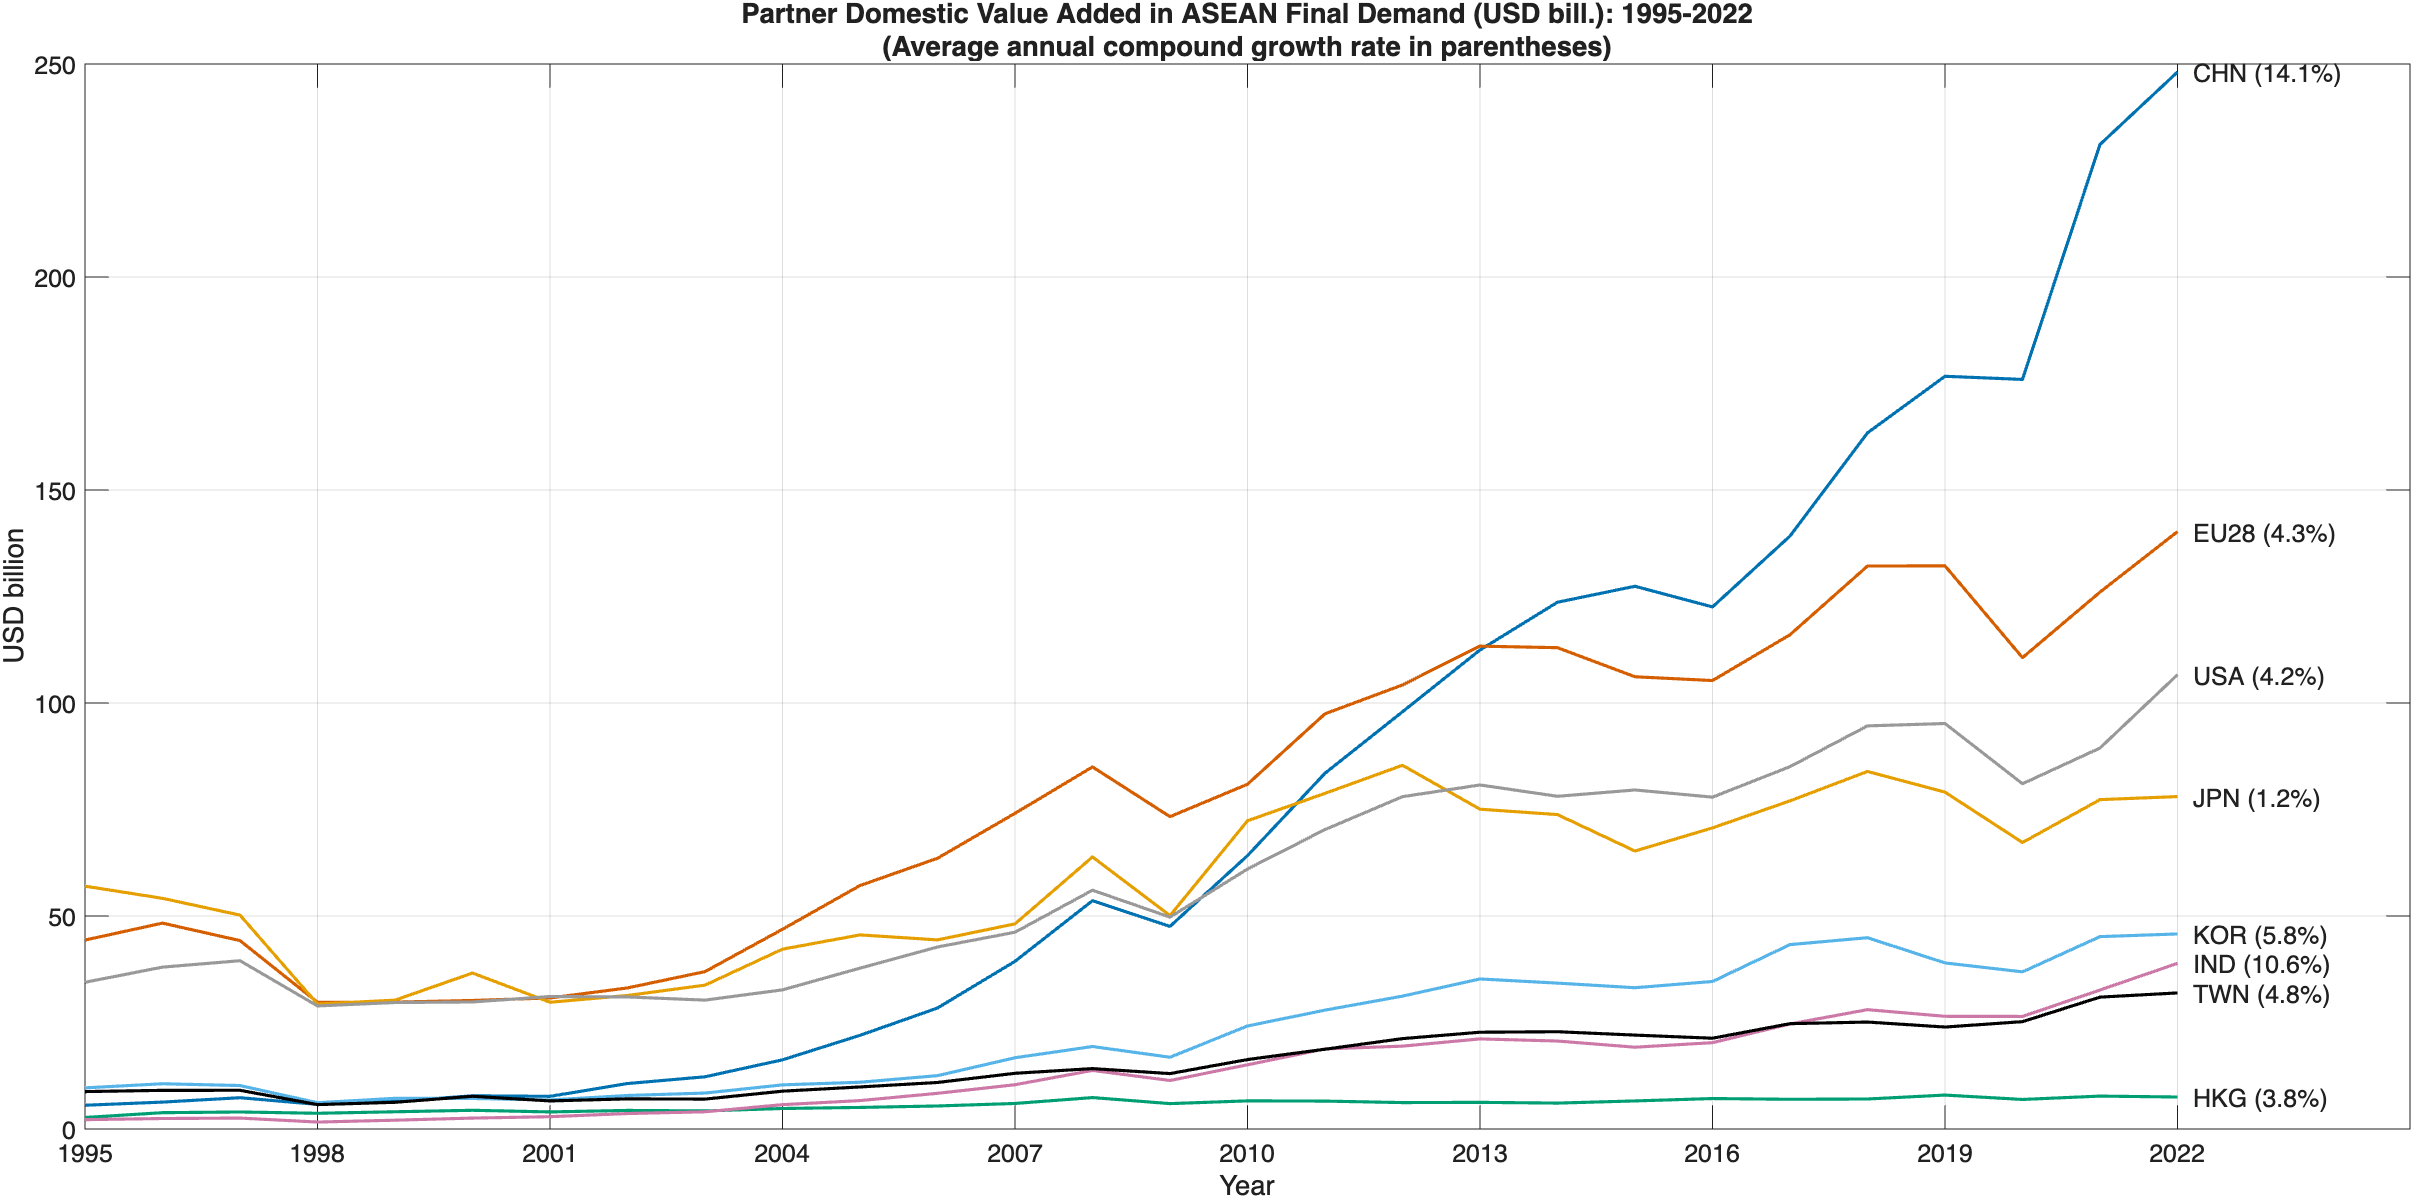
The next two figures show the trends and growth in exports of (ASEAN) domestic value added to selected partners and imports of (Partner) domestic value added into ASEAN from 1995 to 2022 (most recent available). In 2022 about USD 2.88 trillion of ASEAN domestic value added was absorbed in the final demand of the partners shown in the first figure (CHN, USA, EU28, JPN, IND, KOR, TWN, HKG). In the same year, about USD 2.72 trillion of these partners domestic value added was absorbed in the final demand of ASEAN economies. With this selected group of partners, trade in domestic value added is relatively balanced. There is within-group variation. In the case of the US and India, ASEAN exported more domestic value added in 2022 than it imported. There was balance with Hong Kong (SAR) (roughly USD 7.5 billion in both directions) and South Korea (roughly USD 45.7 billion in both directions); and a small deficit with China – ASEAN exported about USD 231 billion of domestic value added to China and imported USD 248 billion worth of Chinese domestic value added.
It is well known that the ASEAN-China relationship has become the most important trading relationship in Asia and this is reflected in both ‘gross’ trade data and trade in value added. The (average annual compound) growth rates of value-added trade are very similar, and the highest among selected partners reflecting deeper integration. Between 1995 and 2022, ASEAN’s domestic value added in China’s final demand grew by 13.4% per annum and China’s domestic value added in ASEAN’s final demand grew slightly faster at 14.1% per annum. ASEAN-India is low in terms of value, but like ASEAN-China, growth has been in double-digits. ASEAN’s DVA exports increased by 12.1% per annum whereas India’s DVA exports grew by 10.6% per annum.
Intra-ASEAN
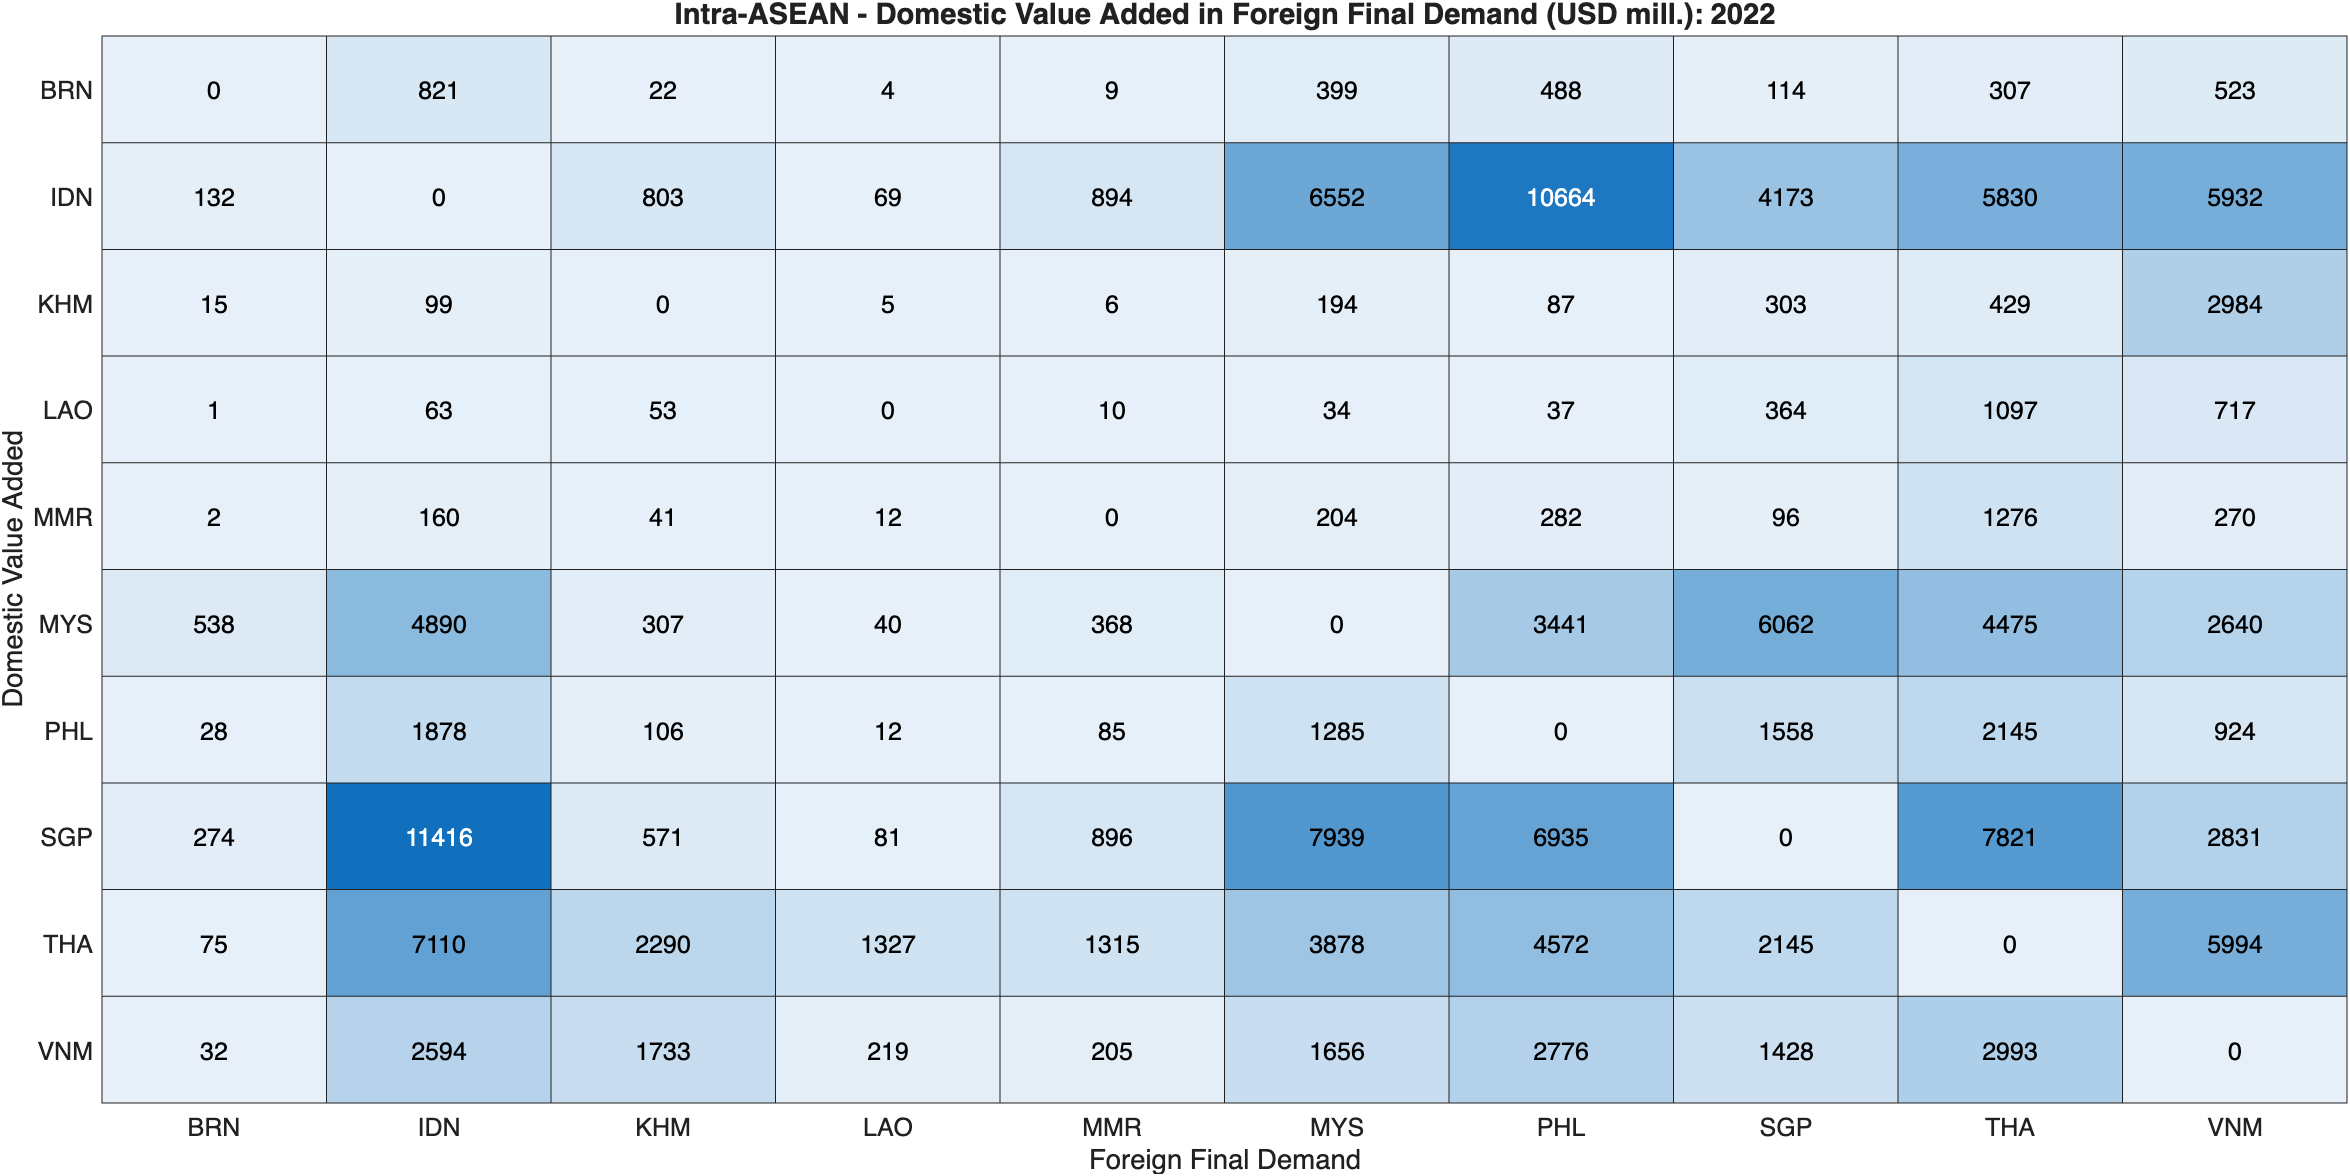
Total intra-ASEAN flows of value-added stood at USD 158.5 billion in 2022. Singapore (USD 38.7 billion), Indonesia (USD 35 billion) and Thailand (USD 28.7 billion) were the top three exporters of domestic value added to the rest of ASEAN. The Philippines (USD 29.3 billion), Indonesia (USD 29 billion) and Thailand (USD 26.4 billion) were the top three importers. Intra-ASEAN flows for 2022 are shown in the following figure. Darker shaded cells in the figure identify the larger flows (in USD million) The larger flows are between the larger economies or ASEAN-5. But a substantial amount of DVA from Lao and Myanmar is embodied in Thai final demand and Thai DVA dominates (compared with other ASEAN economies) the final demand of CLM (Cambodia, Lao, Myanmar) economies. Similar ties can be seen between Vietnam and Cambodia. More of Vietnam’s DVA ended up in Cambodian final demand than in Singaporean or Malaysian final demand. These flows reflect different patterns of intra-ASEAN integration.
Economic Activity
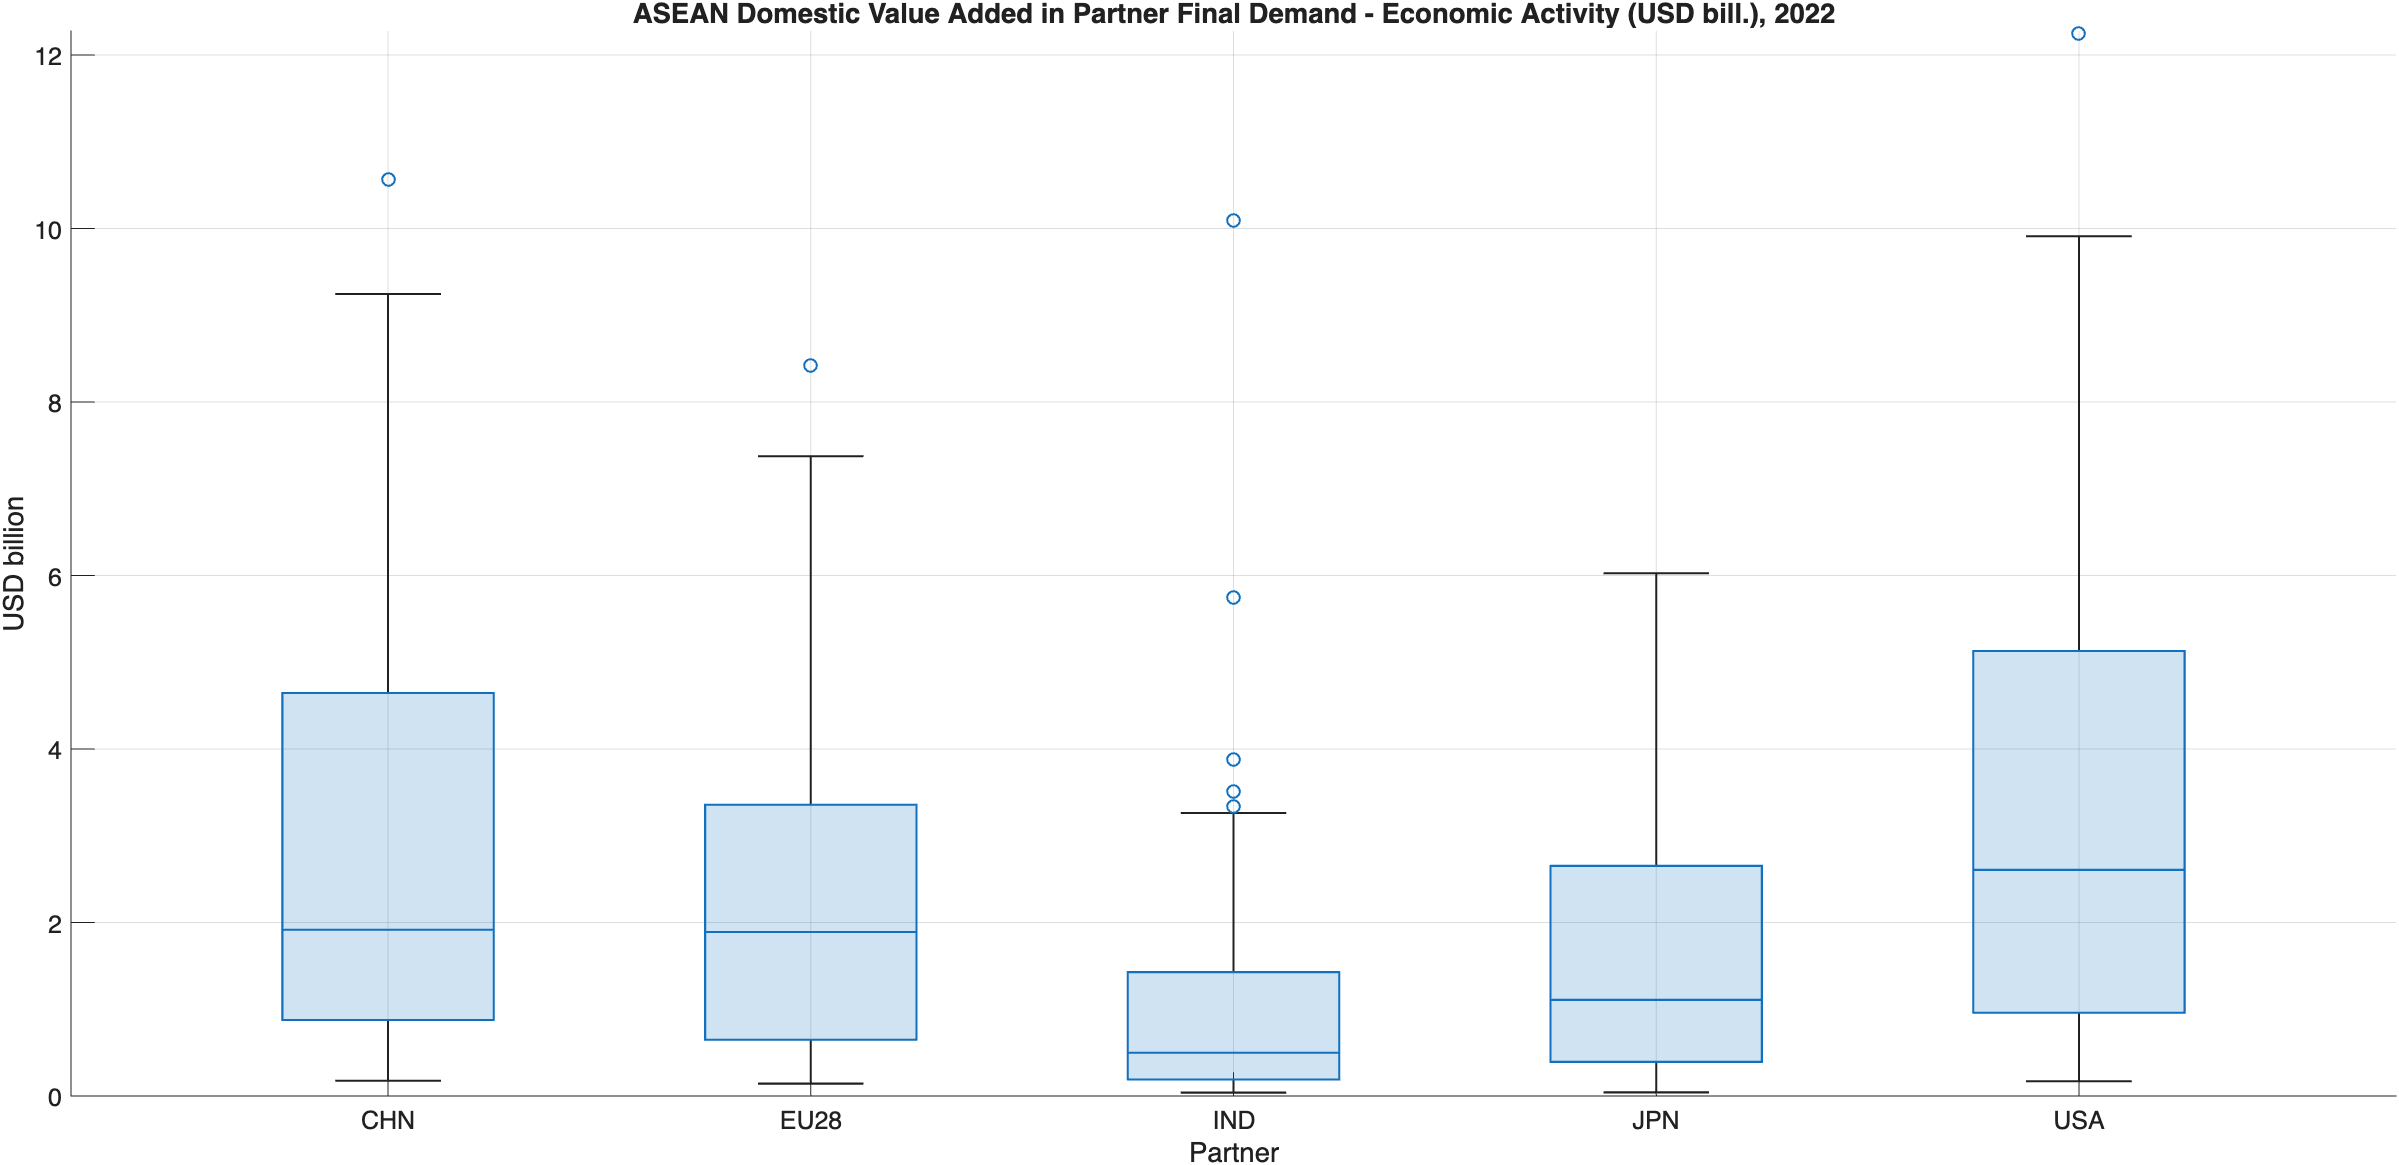
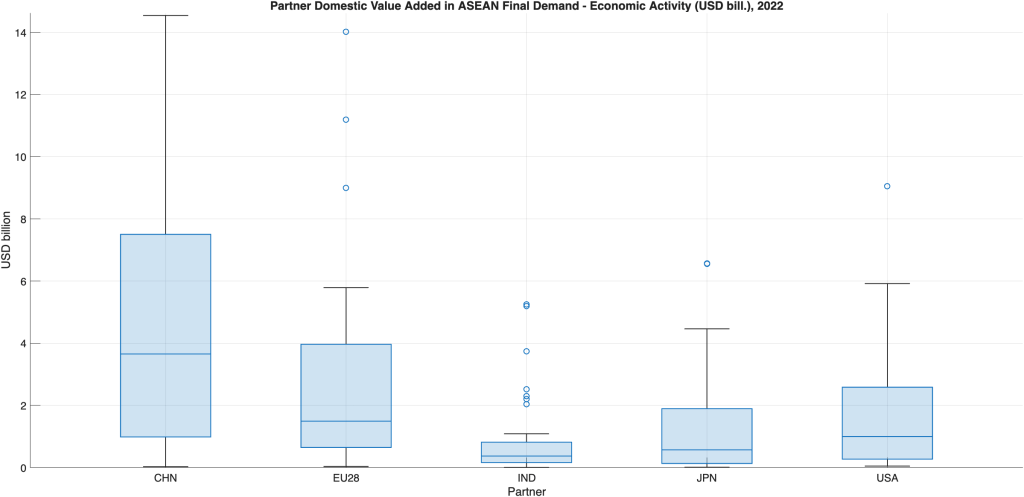
Next, I examine flows across ‘Economic Activity’ (a finer OECD classification than industries). The following two figures show box and whiskers (see notes) plots or dispersion across economic activities. Here the horizontal line in the box represents the median (middle of the distribution – 50th percentile. The bottom of the box is the 25th percentile (quartile 1 (Q1)) and the top of the box is the 75th percentile (quartile 3 (Q3)). The size of the box is the inter-quartile range (IQR = Q3-Q1) and it contains half the observations. Observations outside the whiskers are outliers (and these and other ‘high value’ economic activities are identified later in two tables).
Most of the distributions are skewed since the median lies below the center of the box. India’s distributions are compressed so they are more concentrated (few economic activities) than those of other partners. And so are those of Japan and the US in the second of the two figures. In other words, the exports of DVA from Japan and US (to ASEAN) are concentrated in fewer sectors, relative to ASEAN’s DVA exports to Japan and the US. The opposite is true for China.
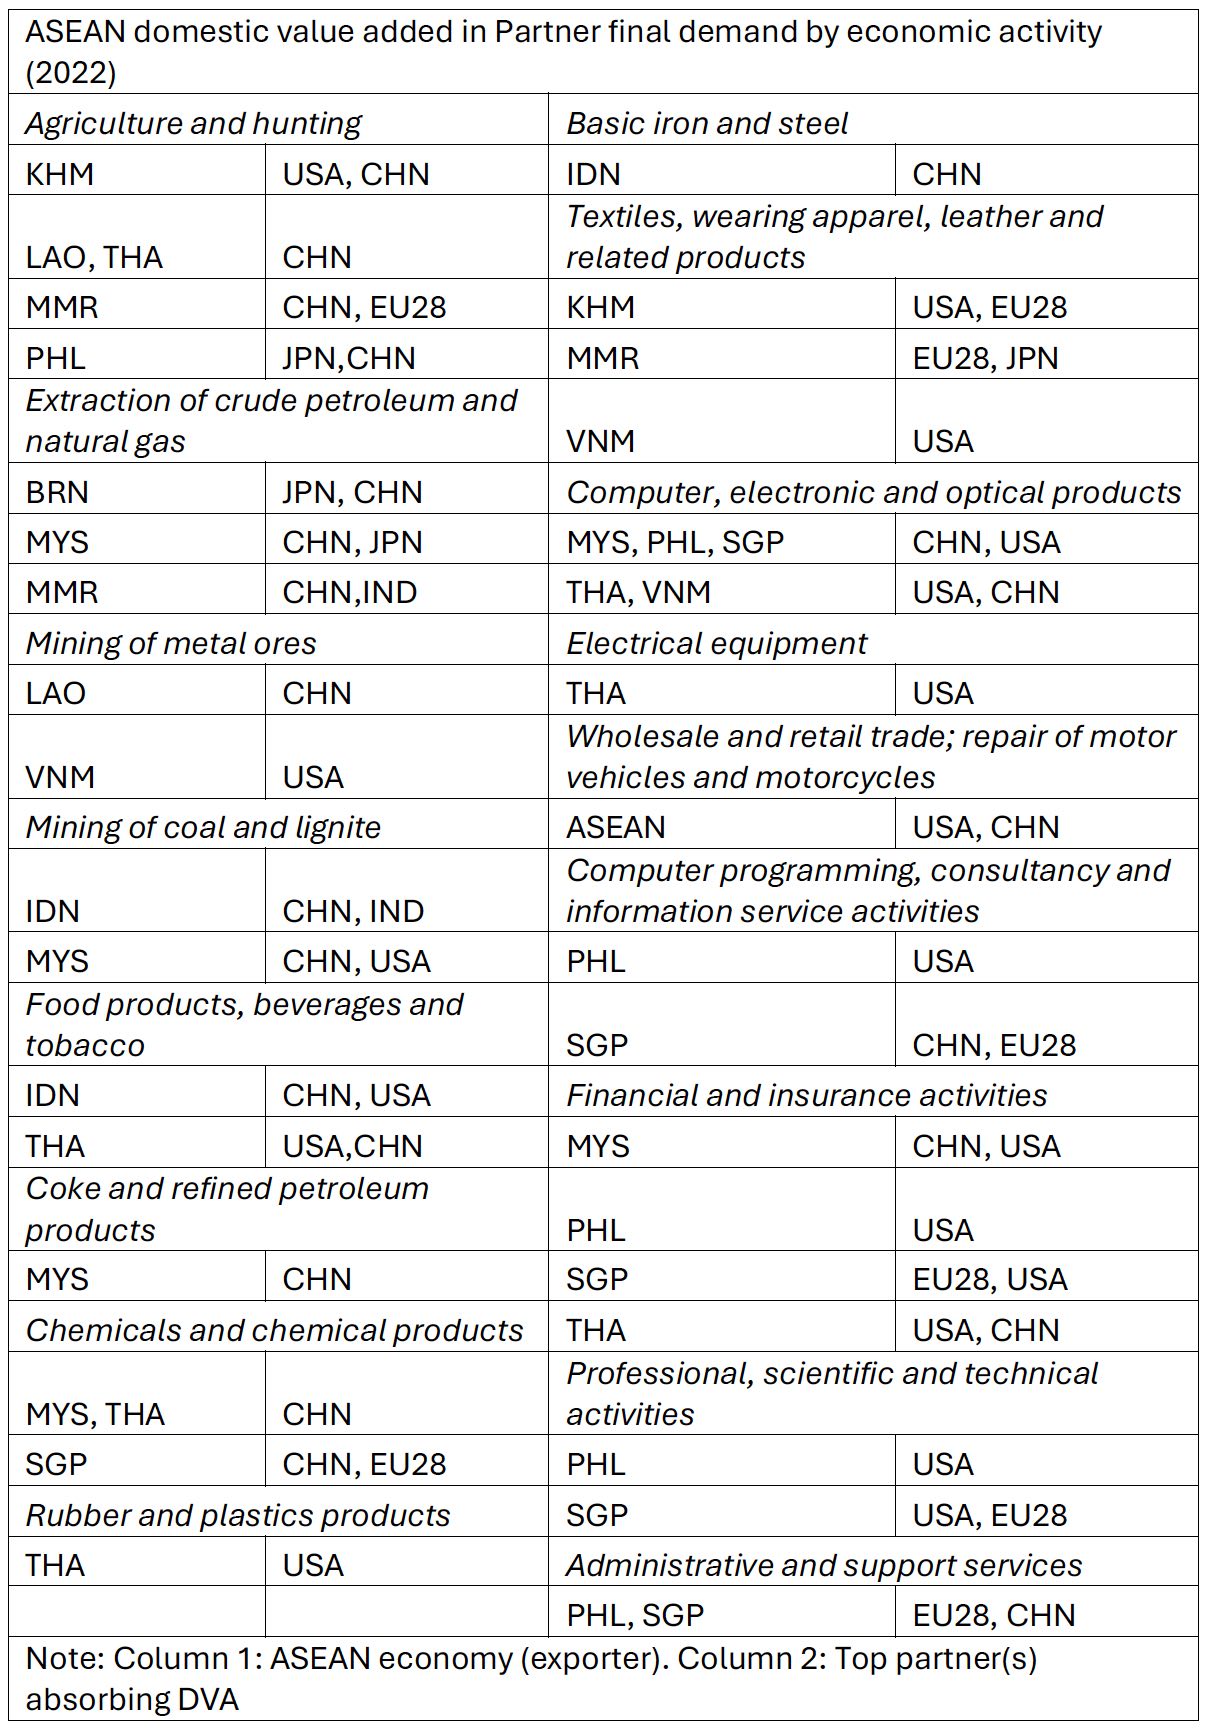
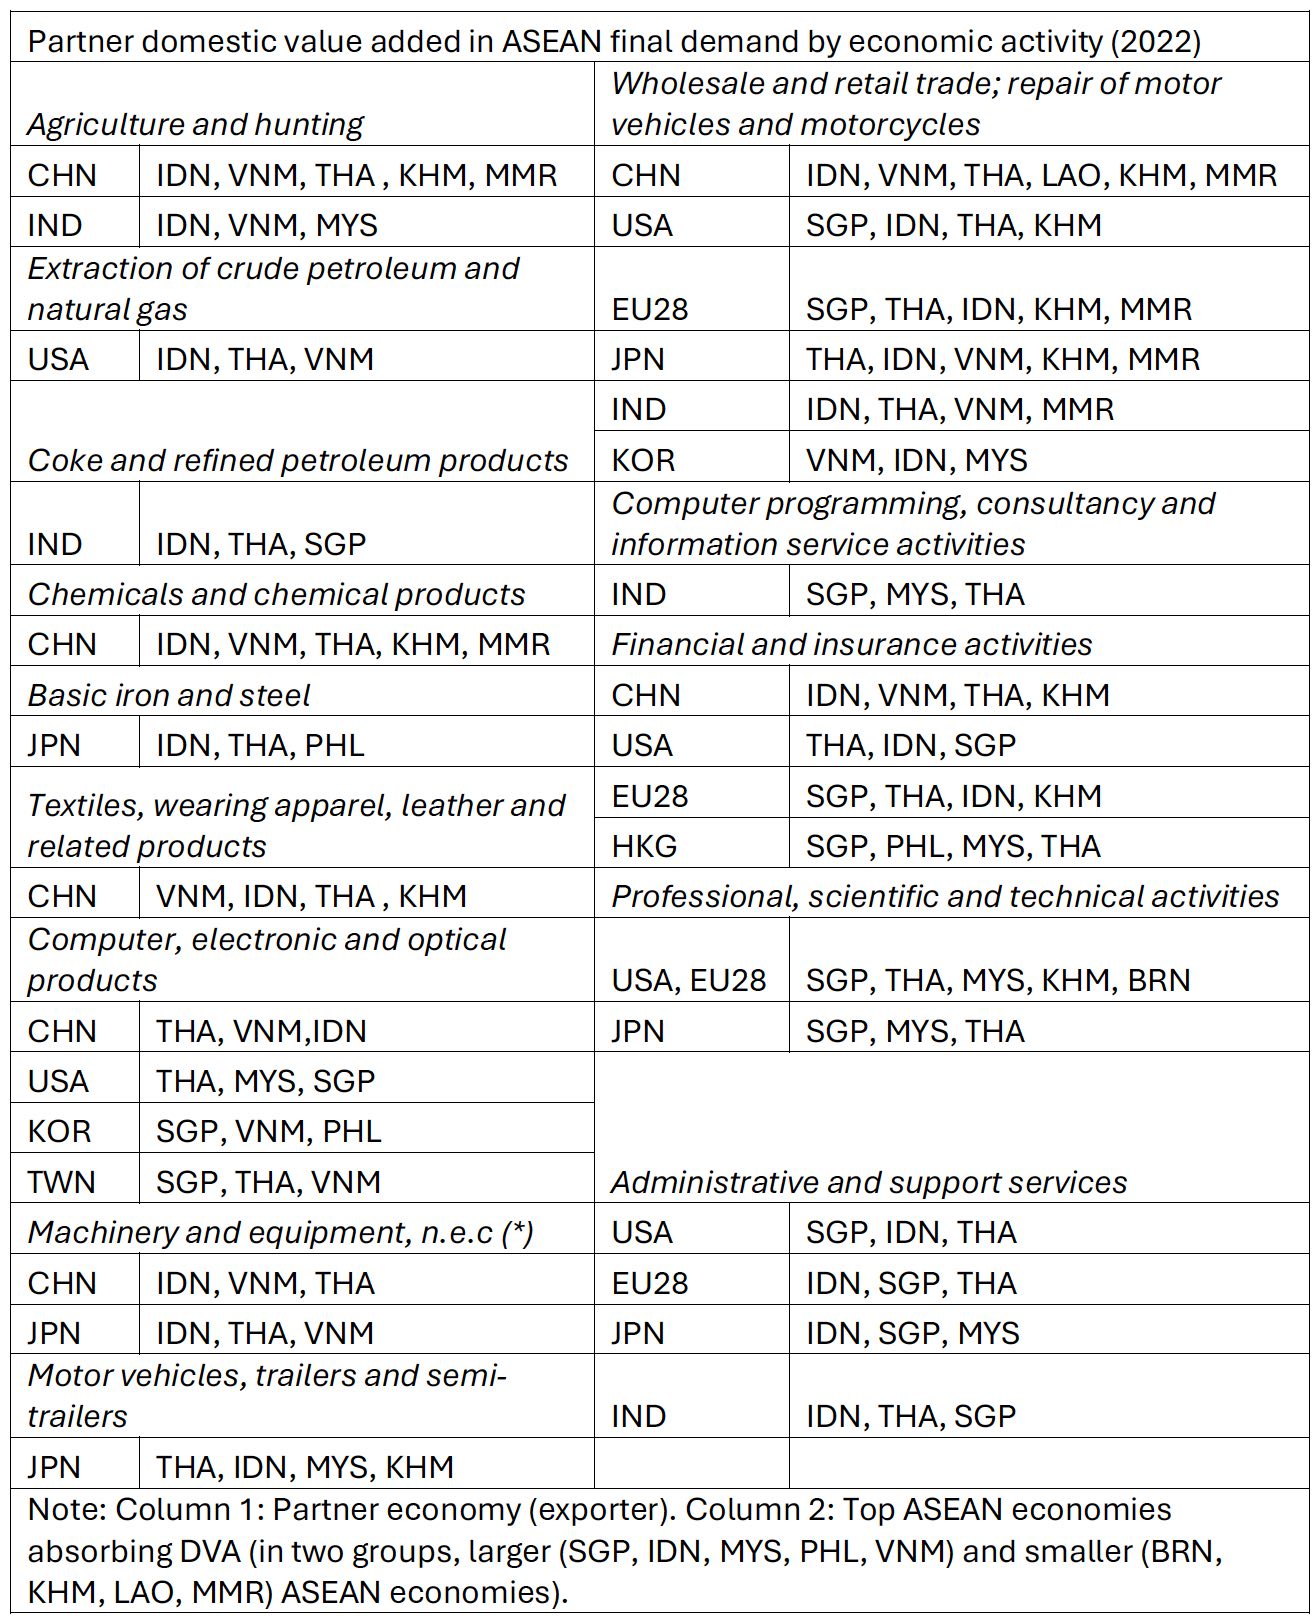
The following two tables provide details of the economic activities which are mainly the outliers. These are the activities which had the highest level (or value) of exported domestic value added or the ‘important’ economic activities. In the first table, the ASEAN economy is the exporter of DVA and the partner economies are (the top one or two) economies in whose final demand the DVA is embodied. The second table shows the reverse flows. In both directions, for almost all economies, Wholesale and retail trade is an important economic activity since all trade in tangibles passes through this service activity. (Readers will have to ask the OECD, why automotive and motorcycle repairs are also included here).
Consider Agriculture and hunting in Cambodia (KHM). For this economic activity in 2022, roughly USD 460 million of Cambodian DVA was embodied in US final demand, followed by China at roughly USD 370 million. Similarly for the Textiles, apparel and leather economic activity, Cambodia exported roughly USD 1.5 billion of DVA to the US and about USD 550 million to EU28 economies. These activities also reflect not Cambodia’s comparative advantage but that of the CLM group of countries in general – primary activities, mining and labour-intensive manufacturing. For Cambodia, exports of DVA in other economic activities are relatively small – between USD 0.1 million – USD 90 million and are excluded from the table.
Whether you like or dislike the government of a country does not appear to matter, since Myanmar’s DVA in Agriculture and hunting and textiles and leather products is consumed by EU28 economies.
Computer, electronic and optical products show intra industry trade in value added between larger ASEAN economies, East-Asian economies (CHN, TWN, KOR) and the US. Singapore and the Philippines exported DVA embodied in services; the former to the US, EU28 and China and the latter, primarily to the US.
On the import of DVA side, Imports of DVA from China are embodied in a wide variety of economic activities, whereas those from the US and EU28 are primarily embodied in services. As expected, India’s DVA is embodied in ASEAN’s final demand for computer and IT services. Japan lies somewhere in the middle, showing strengths in manufacturing and a few services.
The overall picture that emerges may not be very different from one that emerges from ‘gross’ trade flows – deeper two-way integration between ASEAN and its major trading partners, particularly with China where both ASEAN’s exports (13.4%) and imports (14.1%) of DVA have grown fastest. We should expect this to continue with improved connectivity between China and ASEAN – a recent example being the opening of the Pinglu Canal. The economic activities reflect the strengths of the various economies and show how major partners may vary by type of economic activity.
Notes
Box and whiskers:
Bottom of box = 25th percentile (Q1)
Line in box = 50th percentile (median)
Top of box = 75th percentile (Q3)
Inter-Quartile Range IQR = Q3 − Q1
Lower whisker = lowest value ≥ Q1 − 1.5×IQR
Upper whisker = highest value ≤ Q3 + 1.5×IQR
Points beyond whiskers = outliers
Note that for ease of visibility the box and whiskers figures do not show all outliers.
Sources
OECD TIVA (2025 edition)


Leave a Reply